
Hello everyone!
It's time to repeat the most popular patterns in trading.
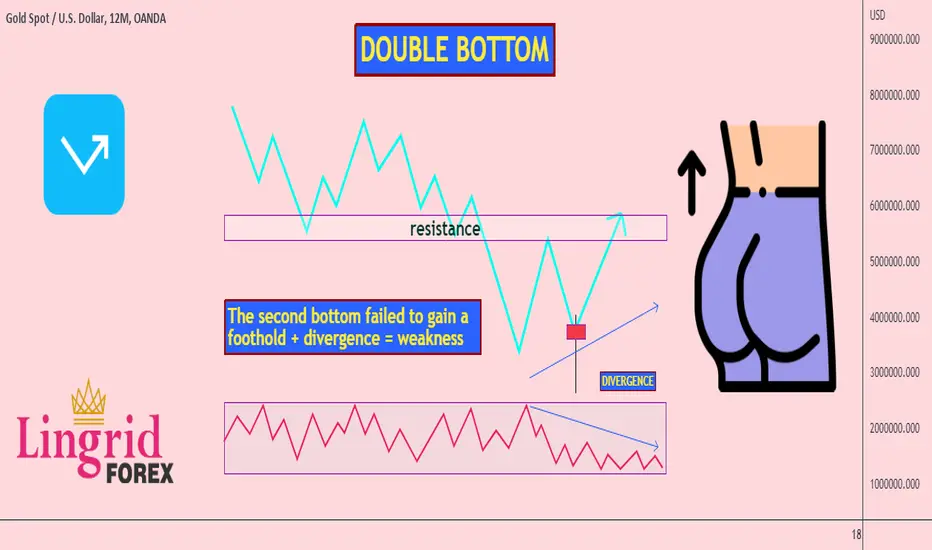
One of these patterns is a DOUBLE BOTTOM.
Forming
There are several factors that you should pay attention to.
First, a new minimum appears.
This breakthrough is accompanied by increased volumes.
Such volumes are fixed by the indicator at this point, because there were a lot of stop orders here and the market absorbed them.
After this breakdown, the price begins a correction.
Nowhere without correction.
The correction is usually made to the breakout level, which used to be support, and now is resistance.
Having reached the level, the price turns down again.
And here is an important point.
If this breakdown is strong, then the price should go to update the lows further.
In theory, you can open short positions in the rebound area in the hope of continuing the trend.
Then we see the formation of the second bottom.
One of the main factors that the price will not fall further is the declining volumes.
This is a divergence.
From this we understand that forces are shifting to the other side and the trend may change.
In addition, we see that the price could not gain a foothold below the first bottom, which tells us about the weakness of sellers.
results
A double bottom is often found on the chart and serves as a signal for closing short positions and possibly opening long positions.
With a proper understanding of this pattern, you can get a lot of profit from trading.
The main thing is not to forget to monitor volumes, divergence and candlesticks that indicate the strength or weakness of the trend.
Traders, if you liked this idea or if you have your own opinion about it, write in the comments. I will be glad 👩💻
It's time to repeat the most popular patterns in trading.
One of these patterns is a DOUBLE BOTTOM.
Forming
There are several factors that you should pay attention to.
First, a new minimum appears.
This breakthrough is accompanied by increased volumes.
Such volumes are fixed by the indicator at this point, because there were a lot of stop orders here and the market absorbed them.
After this breakdown, the price begins a correction.
Nowhere without correction.
The correction is usually made to the breakout level, which used to be support, and now is resistance.
Having reached the level, the price turns down again.
And here is an important point.
If this breakdown is strong, then the price should go to update the lows further.
In theory, you can open short positions in the rebound area in the hope of continuing the trend.
Then we see the formation of the second bottom.
One of the main factors that the price will not fall further is the declining volumes.
This is a divergence.
From this we understand that forces are shifting to the other side and the trend may change.
In addition, we see that the price could not gain a foothold below the first bottom, which tells us about the weakness of sellers.
results
A double bottom is often found on the chart and serves as a signal for closing short positions and possibly opening long positions.
With a proper understanding of this pattern, you can get a lot of profit from trading.
The main thing is not to forget to monitor volumes, divergence and candlesticks that indicate the strength or weakness of the trend.
Traders, if you liked this idea or if you have your own opinion about it, write in the comments. I will be glad 👩💻

🔥 Daily GOLD and Forex updates with 20,000+ active traders:
t.me/LingridChannel
🚀 Daily CRYPTO setups:
bit.ly/3JIGE2j
t.me/LingridChannel
🚀 Daily CRYPTO setups:
bit.ly/3JIGE2j
Publicaciones relacionadas
Exención de responsabilidad
La información y las publicaciones no constituyen, ni deben considerarse como, asesoramiento o recomendaciones financieras, de inversión, de trading u otro tipo, proporcionadas o respaldadas por TradingView. Obtenga más información en Condiciones de uso.
🔥 Daily GOLD and Forex updates with 20,000+ active traders:
t.me/LingridChannel
🚀 Daily CRYPTO setups:
bit.ly/3JIGE2j
t.me/LingridChannel
🚀 Daily CRYPTO setups:
bit.ly/3JIGE2j
Publicaciones relacionadas
Exención de responsabilidad
La información y las publicaciones no constituyen, ni deben considerarse como, asesoramiento o recomendaciones financieras, de inversión, de trading u otro tipo, proporcionadas o respaldadas por TradingView. Obtenga más información en Condiciones de uso.