
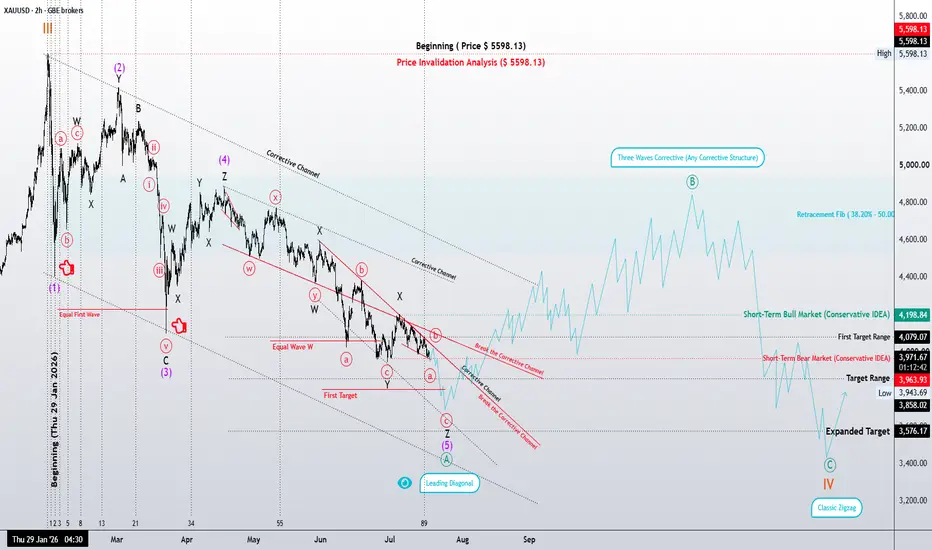
XAUUSD | 2H Elliott Wave Update
According to the higher-degree Weekly and Daily wave counts, Gold continues to develop Wave IV. This analysis is based on the Elliott Wave Principle, following both its core rules and structural guidelines while focusing on market structure rather than price prediction.
The primary focus of this update is a Leading Diagonal, currently identified as part of Wave A. Price has now reached a region where this structure may be complete. However, until the market provides structural confirmation, the Leading Diagonal cannot be considered finished with certainty.
According to the Elliott Wave Principle, Waves 2 and 4 within a Leading Diagonal must unfold as Zigzag corrections, whether single, double, or triple. Likewise, Waves 1, 3, and 5 may develop either as Impulses or as Zigzags, with those Zigzags also appearing in single or multiple forms.
At the current stage, Wave 5 of the Leading Diagonal is displaying signs of structural complexity. Therefore, two scenarios remain equally valid. The first suggests that the Leading Diagonal has already been completed and the market is ready to begin Wave B. The second assumes that one final minor decline—or a brief capitulation move—is still required before the diagonal can be considered complete.
From a structural perspective, a confirmed breakout above the descending corrective channel would provide the first meaningful evidence that Wave B has begun. Until then, additional downside movement within the current structure remains a valid possibility.
Once the Leading Diagonal is confirmed complete, the preferred scenario is for Wave B to unfold, followed by Wave C, ultimately completing Wave IV as a classic A–B–C Zigzag. Fibonacci retracement levels may help identify potential reversal zones, but in this analysis, market structure always takes precedence over price ratios.
Research Notes
One observation that has repeatedly caught my attention is the visual similarity between some Leading Diagonals and Triple Zigzags. In several markets, I have seen price confined within converging trendlines, initially appearing to be a textbook Leading Diagonal. However, as the structure matured, it became evident that the market was actually developing a Triple Zigzag.
This occurs because multiple Zigzags can sometimes produce a wedge-like appearance. For that reason, visual pattern recognition alone is never sufficient. The internal wave relationships and the structural rules of the Elliott Wave Principle remain the decisive factors.
Another key element is the relationship between Gold and the U.S. Dollar Index (DXY). Although these markets generally maintain an inverse correlation, historical observations suggest that this relationship is not always constant. There have been periods in which Gold continued building a bullish structure despite a rising Dollar Index. In such situations, one market appears to be correcting through time, while the other progresses toward a price objective.
For this reason, I place greater emphasis on wave structure and price behavior than on traditional intermarket correlations alone.
Unless the market proves otherwise, my preferred expectation remains unchanged: once the Leading Diagonal is complete, Wave B should develop first, followed by Wave C, ultimately completing Wave IV as a classic Zigzag correction.
Price is the outcome; Structure is the cause.
Patterns whisper. I listen.
— Mr.Nobody
Gold Spot / U.S. Dollar
7 days ago
Gold | One More Wave… or Has Wave B Already Begun?

Gold Spot / U.S. Dollar
May 17
Gold 4H: Leading Diagonal or Just the Beginning?
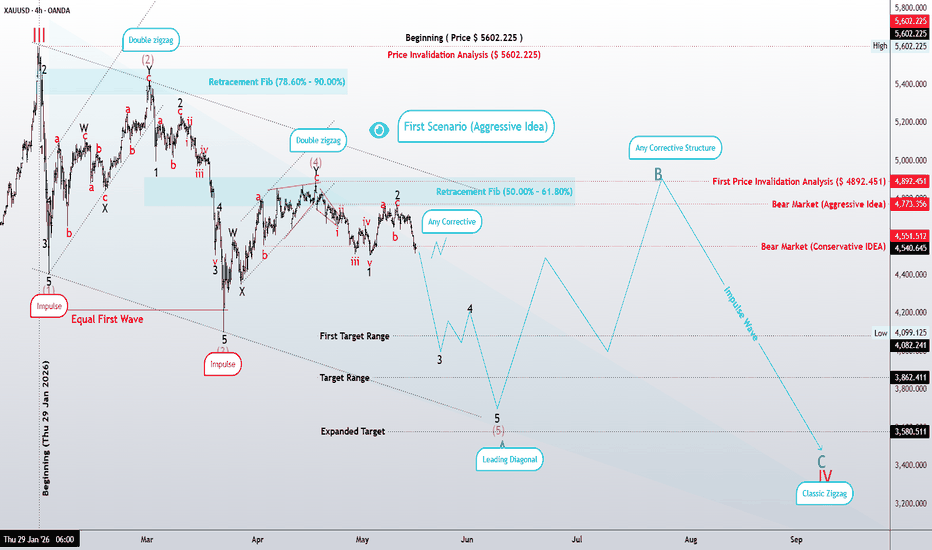
According to the higher-degree Weekly and Daily wave counts, Gold continues to develop Wave IV. This analysis is based on the Elliott Wave Principle, following both its core rules and structural guidelines while focusing on market structure rather than price prediction.
The primary focus of this update is a Leading Diagonal, currently identified as part of Wave A. Price has now reached a region where this structure may be complete. However, until the market provides structural confirmation, the Leading Diagonal cannot be considered finished with certainty.
According to the Elliott Wave Principle, Waves 2 and 4 within a Leading Diagonal must unfold as Zigzag corrections, whether single, double, or triple. Likewise, Waves 1, 3, and 5 may develop either as Impulses or as Zigzags, with those Zigzags also appearing in single or multiple forms.
At the current stage, Wave 5 of the Leading Diagonal is displaying signs of structural complexity. Therefore, two scenarios remain equally valid. The first suggests that the Leading Diagonal has already been completed and the market is ready to begin Wave B. The second assumes that one final minor decline—or a brief capitulation move—is still required before the diagonal can be considered complete.
From a structural perspective, a confirmed breakout above the descending corrective channel would provide the first meaningful evidence that Wave B has begun. Until then, additional downside movement within the current structure remains a valid possibility.
Once the Leading Diagonal is confirmed complete, the preferred scenario is for Wave B to unfold, followed by Wave C, ultimately completing Wave IV as a classic A–B–C Zigzag. Fibonacci retracement levels may help identify potential reversal zones, but in this analysis, market structure always takes precedence over price ratios.
Research Notes
One observation that has repeatedly caught my attention is the visual similarity between some Leading Diagonals and Triple Zigzags. In several markets, I have seen price confined within converging trendlines, initially appearing to be a textbook Leading Diagonal. However, as the structure matured, it became evident that the market was actually developing a Triple Zigzag.
This occurs because multiple Zigzags can sometimes produce a wedge-like appearance. For that reason, visual pattern recognition alone is never sufficient. The internal wave relationships and the structural rules of the Elliott Wave Principle remain the decisive factors.
Another key element is the relationship between Gold and the U.S. Dollar Index (DXY). Although these markets generally maintain an inverse correlation, historical observations suggest that this relationship is not always constant. There have been periods in which Gold continued building a bullish structure despite a rising Dollar Index. In such situations, one market appears to be correcting through time, while the other progresses toward a price objective.
For this reason, I place greater emphasis on wave structure and price behavior than on traditional intermarket correlations alone.
Unless the market proves otherwise, my preferred expectation remains unchanged: once the Leading Diagonal is complete, Wave B should develop first, followed by Wave C, ultimately completing Wave IV as a classic Zigzag correction.
Price is the outcome; Structure is the cause.
Patterns whisper. I listen.
— Mr.Nobody
Gold Spot / U.S. Dollar
7 days ago
Gold | One More Wave… or Has Wave B Already Begun?
Gold Spot / U.S. Dollar
May 17
Gold 4H: Leading Diagonal or Just the Beginning?

Publicaciones relacionadas
Exención de responsabilidad
La información y las publicaciones no constituyen, ni deben considerarse como, asesoramiento o recomendaciones financieras, de inversión, de trading u otro tipo, proporcionadas o respaldadas por TradingView. Obtenga más información en Condiciones de uso.
Publicaciones relacionadas
Exención de responsabilidad
La información y las publicaciones no constituyen, ni deben considerarse como, asesoramiento o recomendaciones financieras, de inversión, de trading u otro tipo, proporcionadas o respaldadas por TradingView. Obtenga más información en Condiciones de uso.