
## **Market Overview**
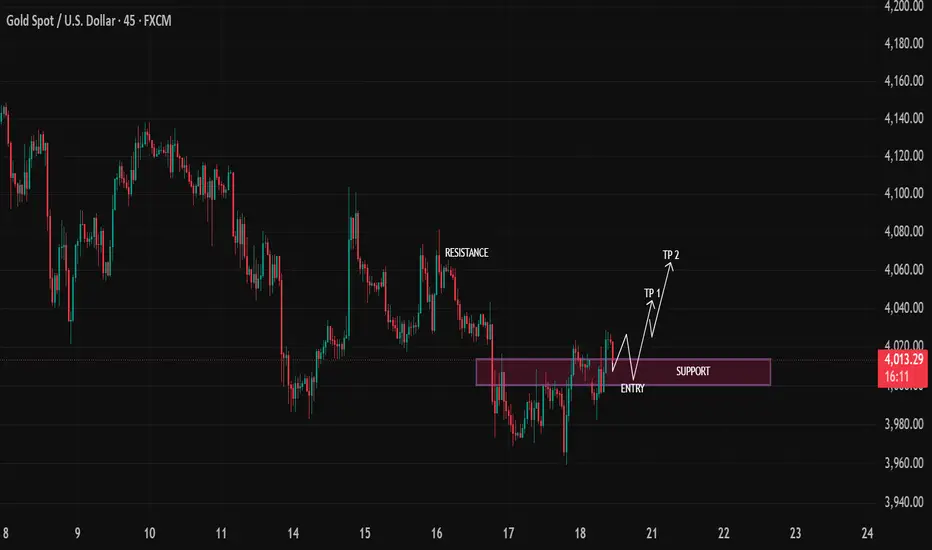
The 45-minute XAU/USD chart shows that gold remains in a **short-term recovery phase** after establishing a swing low around the **3,965–3,980** region. Buyers have regained momentum, pushing price back above the psychological **4,000** level while approaching a previous supply area.
Although the broader trend has recently been bearish, the current structure suggests a **potential trend continuation to the upside**, provided the marked support zone continues to hold.
---
# **Technical Structure**
### **1. Market Trend**
* **Higher Low Formation:** Bullish
* **Short-Term Momentum:** Positive
* **Overall Structure:** Recovery within a broader downtrend
Price has started printing higher lows after rejecting the recent lows, indicating buyers are gradually taking control.
---
### **2. Support Zone**
**Support Area:** **4,000 – 4,010**
This highlighted purple zone represents:
* Previous resistance turned support
* Multiple candle reactions
* Strong buying interest
* Psychological round-number support
As long as price remains above this area, the bullish scenario remains valid.
---
### **3. Resistance Zone**
Nearest resistance sits around:
**4,040 – 4,060**
This area has rejected price several times previously and could temporarily slow bullish momentum.
A successful breakout above this level would confirm stronger buying pressure.
---
# **Trade Scenario**
## **Preferred Setup: Buy the Pullback**
Rather than chasing price higher, waiting for a retracement into support provides a better risk-to-reward opportunity.
### **Entry**
* Buy near **4,000–4,010**
* Wait for bullish confirmation (bullish engulfing, pin bar, or strong rejection candle).
---
### **Stop Loss**
Below the recent swing low.
Suggested area:
**3,985–3,990**
---
### **Take Profit Targets**
**TP1**
* **4,040–4,045**
* Previous intraday resistance
**TP2**
* **4,055–4,065**
* Major resistance and projected measured move
---
# **Bullish Confirmation Signals**
Look for:
* Bullish engulfing candle
* Long lower wick rejection
* Strong buying volume
* Break above recent swing high
* Higher low maintained
These would strengthen the probability of continuation toward the target zones.
---
# **Invalidation Scenario**
The bullish outlook becomes weaker if:
* Price closes decisively below **4,000**
* Support fails with strong bearish momentum
* Lower lows begin forming
In that case, sellers could retest:
* **3,980**
* **3,965**
* **3,950**
---
# **Risk Management**
* Risk no more than **1–2%** of trading capital per position.
* Wait for confirmation before entering rather than placing a blind limit order.
* Aim for a **minimum risk-to-reward ratio of 1:2**, with **1:3** preferred if targeting TP2.
---
# **Professional Outlook**
The chart presents a **bullish pullback opportunity** rather than a breakout trade. The **4,000–4,010 support zone** is the key technical area to monitor. A confirmed bounce from this region could propel XAU/USD toward **4,040 (TP1)** and **4,060 (TP2)**. However, a decisive breakdown below support would invalidate the bullish setup and shift the short-term bias back to bearish.
**Bias:** **Moderately Bullish (Buy on Pullback)**
**Key Support:** **4,000–4,010**
**Key Resistance:** **4,040–4,060**
**Trading Strategy:** **Wait for a pullback into support, confirm buyer strength, then target higher resistance levels.**
The 45-minute XAU/USD chart shows that gold remains in a **short-term recovery phase** after establishing a swing low around the **3,965–3,980** region. Buyers have regained momentum, pushing price back above the psychological **4,000** level while approaching a previous supply area.
Although the broader trend has recently been bearish, the current structure suggests a **potential trend continuation to the upside**, provided the marked support zone continues to hold.
---
# **Technical Structure**
### **1. Market Trend**
* **Higher Low Formation:** Bullish
* **Short-Term Momentum:** Positive
* **Overall Structure:** Recovery within a broader downtrend
Price has started printing higher lows after rejecting the recent lows, indicating buyers are gradually taking control.
---
### **2. Support Zone**
**Support Area:** **4,000 – 4,010**
This highlighted purple zone represents:
* Previous resistance turned support
* Multiple candle reactions
* Strong buying interest
* Psychological round-number support
As long as price remains above this area, the bullish scenario remains valid.
---
### **3. Resistance Zone**
Nearest resistance sits around:
**4,040 – 4,060**
This area has rejected price several times previously and could temporarily slow bullish momentum.
A successful breakout above this level would confirm stronger buying pressure.
---
# **Trade Scenario**
## **Preferred Setup: Buy the Pullback**
Rather than chasing price higher, waiting for a retracement into support provides a better risk-to-reward opportunity.
### **Entry**
* Buy near **4,000–4,010**
* Wait for bullish confirmation (bullish engulfing, pin bar, or strong rejection candle).
---
### **Stop Loss**
Below the recent swing low.
Suggested area:
**3,985–3,990**
---
### **Take Profit Targets**
**TP1**
* **4,040–4,045**
* Previous intraday resistance
**TP2**
* **4,055–4,065**
* Major resistance and projected measured move
---
# **Bullish Confirmation Signals**
Look for:
* Bullish engulfing candle
* Long lower wick rejection
* Strong buying volume
* Break above recent swing high
* Higher low maintained
These would strengthen the probability of continuation toward the target zones.
---
# **Invalidation Scenario**
The bullish outlook becomes weaker if:
* Price closes decisively below **4,000**
* Support fails with strong bearish momentum
* Lower lows begin forming
In that case, sellers could retest:
* **3,980**
* **3,965**
* **3,950**
---
# **Risk Management**
* Risk no more than **1–2%** of trading capital per position.
* Wait for confirmation before entering rather than placing a blind limit order.
* Aim for a **minimum risk-to-reward ratio of 1:2**, with **1:3** preferred if targeting TP2.
---
# **Professional Outlook**
The chart presents a **bullish pullback opportunity** rather than a breakout trade. The **4,000–4,010 support zone** is the key technical area to monitor. A confirmed bounce from this region could propel XAU/USD toward **4,040 (TP1)** and **4,060 (TP2)**. However, a decisive breakdown below support would invalidate the bullish setup and shift the short-term bias back to bearish.
**Bias:** **Moderately Bullish (Buy on Pullback)**
**Key Support:** **4,000–4,010**
**Key Resistance:** **4,040–4,060**
**Trading Strategy:** **Wait for a pullback into support, confirm buyer strength, then target higher resistance levels.**

JOIN MY TELEGRAM CHANNEL FREE :
t.me/SMARTPROFITHUB2
t.me/SMARTPROFITHUB2
Exención de responsabilidad
La información y las publicaciones no constituyen, ni deben considerarse como, asesoramiento o recomendaciones financieras, de inversión, de trading u otro tipo, proporcionadas o respaldadas por TradingView. Obtenga más información en Condiciones de uso.
JOIN MY TELEGRAM CHANNEL FREE :
t.me/SMARTPROFITHUB2
t.me/SMARTPROFITHUB2
Exención de responsabilidad
La información y las publicaciones no constituyen, ni deben considerarse como, asesoramiento o recomendaciones financieras, de inversión, de trading u otro tipo, proporcionadas o respaldadas por TradingView. Obtenga más información en Condiciones de uso.