
Executive Summary (1D & 4H Timeframes):
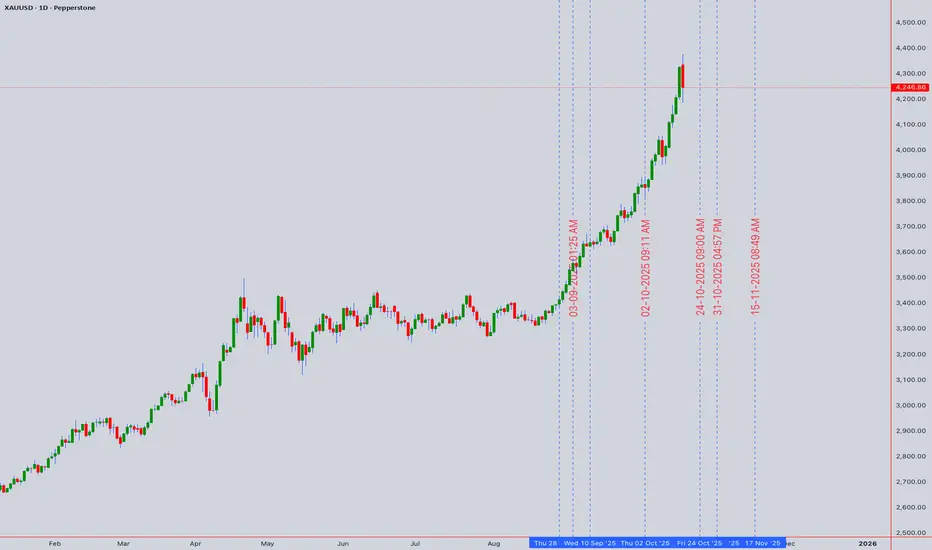
Gold is at a critical juncture. The daily chart reveals a battle between a dominant Head and Shoulders top pattern and a potential Elliott Wave 4 corrective pullback. The neckline at 4,220 is the line in the sand. A decisive break below confirms the H&S pattern, targeting 4,150. However, the 4H chart shows consolidation above this level, with the 200-EMA (4,235) and the 50% Fibonacci retracement providing immediate support. The RSI is bearish but not oversold, suggesting room for a move in either direction. The overarching trend from the last major low remains intact until 4,220 gives way.
Swing Trading Strategy (4H/Daily):
Intraday Trading Plan (1H/30M/15M):
Key Market Drivers & Alerts:
Final Word:
Trade safe and follow the price action. Like and follow for continued high-quality analysis!
Gold is at a critical juncture. The daily chart reveals a battle between a dominant Head and Shoulders top pattern and a potential Elliott Wave 4 corrective pullback. The neckline at 4,220 is the line in the sand. A decisive break below confirms the H&S pattern, targeting 4,150. However, the 4H chart shows consolidation above this level, with the 200-EMA (4,235) and the 50% Fibonacci retracement providing immediate support. The RSI is bearish but not oversold, suggesting room for a move in either direction. The overarching trend from the last major low remains intact until 4,220 gives way.
Swing Trading Strategy (4H/Daily):
- BEARISH SCENARIO (Below 4,220): Sell on a confirmed break and close below 4,220. Initial Target: 4,180 (H&S Measured Move). Final Target: 4,150. Stop Loss: 4,265 (above recent swing high).
- BULLISH SCENARIO (Above 4,265): A hold above 4,235 (200-EMA) and a break above 4,265 invalidates the immediate bearish structure, targeting a retest of 4,300. Buy on a bullish reversal candle above 4,235. Stop Loss: 4,210.
Intraday Trading Plan (1H/30M/15M):
- SHORT SETUP: Look for price rejection at the 4,255 - 4,260 resistance zone (aligned with 4H VWAP and 50-EMA) with bearish candlestick confirmation (e.g., Bearish Engulfing). Sell Entry: 4,255. Target 1: 4,240. Target 2: 4,225. Stop Loss: 4,268.
- LONG SETUP: Only valid if price holds above 4,235 and shows strength. A bounce from 4,235-4,240 with a bullish candle (Hammer, Bullish Engulfing) offers a long opportunity. Buy Entry: 4,238. Target 1: 4,255. Target 2: 4,265. Stop Loss: 4,225.
Key Market Drivers & Alerts:
- Geopolitical & Macro Watch: Monitor USD strength (DXY) and real yields. Any escalation in global tensions could trigger a safe-haven rush, invalidating technical bearishness.
- Indicator Cluster: The convergence of the 200-EMA, Fibonacci support, and the H&S neckline creates a high-probability zone for the next significant move.
Final Word:
The path of least resistance is bearish below 4,220. Intraday traders can fade rallies towards 4,255-4,260, while swing traders await the decisive break. Always manage risk; a close above 4,265 flips the script to bullish.
Trade safe and follow the price action. Like and follow for continued high-quality analysis!

I am nothing @shunya.trade
Exención de responsabilidad
La información y las publicaciones no constituyen, ni deben considerarse como, asesoramiento o recomendaciones financieras, de inversión, de trading u otro tipo, proporcionadas o respaldadas por TradingView. Obtenga más información en Condiciones de uso.
I am nothing @shunya.trade
Exención de responsabilidad
La información y las publicaciones no constituyen, ni deben considerarse como, asesoramiento o recomendaciones financieras, de inversión, de trading u otro tipo, proporcionadas o respaldadas por TradingView. Obtenga más información en Condiciones de uso.