
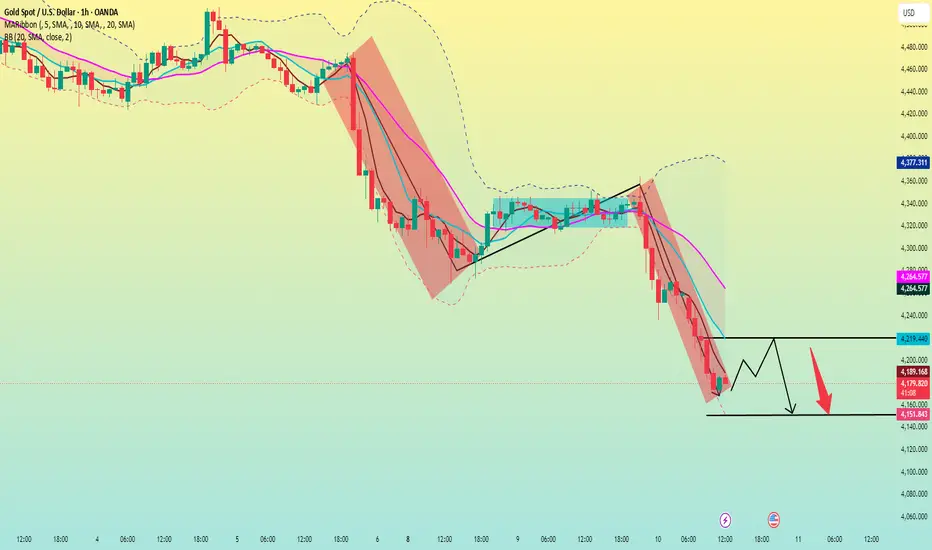
The downward trend continues. Sell on a rebound to 4220.
Technical analysis of the 4-hour chart reveals that the price is moving within a standard bearish channel; the lower Bollinger Band is sloping downward, indicating a bearish alignment. A "death cross" formed by the MA20 and MA60 moving averages is exerting downward pressure, and repeated failed attempts to break above the MA20 resistance confirm the bears' firm control. Although the KDJ indicator has entered oversold territory, there are no clear signs of divergence, suggesting limited potential for a technical rebound.
The 1-hour chart shows a complete short-term downtrend structure with significant top-to-bottom reversal characteristics. During the US session on Tuesday, the price faced resistance after rebounding to 4250 and subsequently retreated, forming a classic bearish continuation pattern. The short-term moving average alignment remains bearish, and the decline is accompanied by volume, indicating persistent selling pressure. Following the break below the 4200 mark during the Asian session, this level has shifted from support to resistance; unless the price can stabilize above 4200 during the day, the downward trend is likely to continue.
Short-term trading strategy: Go short on a rebound to the 4220 area, with targets at 4170–4150.
The 1-hour chart shows a complete short-term downtrend structure with significant top-to-bottom reversal characteristics. During the US session on Tuesday, the price faced resistance after rebounding to 4250 and subsequently retreated, forming a classic bearish continuation pattern. The short-term moving average alignment remains bearish, and the decline is accompanied by volume, indicating persistent selling pressure. Following the break below the 4200 mark during the Asian session, this level has shifted from support to resistance; unless the price can stabilize above 4200 during the day, the downward trend is likely to continue.
Short-term trading strategy: Go short on a rebound to the 4220 area, with targets at 4170–4150.
Operación activa
The price has reached the entry point for our short-selling strategy; please execute the trade immediately.Operación cerrada: objetivo alcanzado
Congratulations to everyone who executed the sell strategy; we’ve made a nice profit.
Exención de responsabilidad
La información y las publicaciones no constituyen, ni deben considerarse como, asesoramiento o recomendaciones financieras, de inversión, de trading u otro tipo, proporcionadas o respaldadas por TradingView. Obtenga más información en Condiciones de uso.
Exención de responsabilidad
La información y las publicaciones no constituyen, ni deben considerarse como, asesoramiento o recomendaciones financieras, de inversión, de trading u otro tipo, proporcionadas o respaldadas por TradingView. Obtenga más información en Condiciones de uso.