
Dear all,
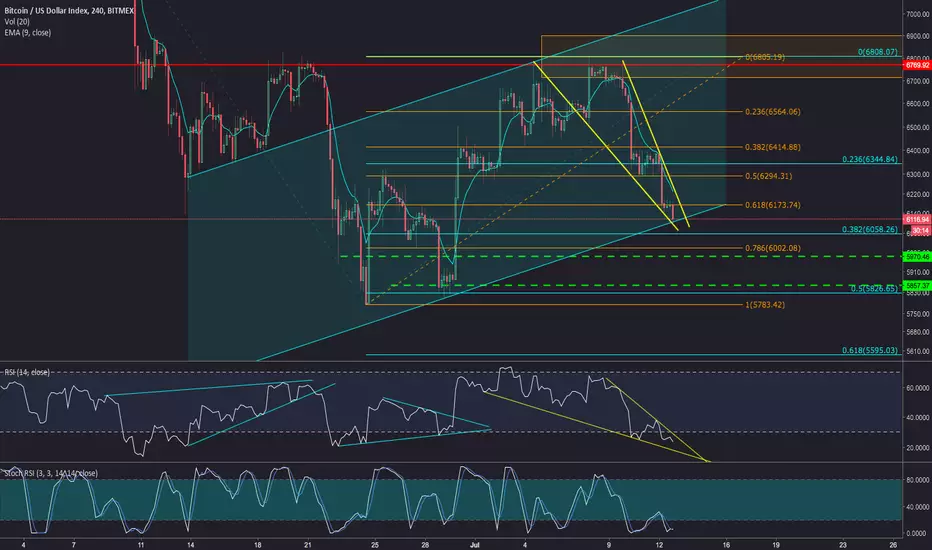
A quick chart on how I am monitoring BTC right now.
I see a lot of bullish signs on this red days, like we shall see a lot of bearish signs after several green days.
- RSI is bottomed
- Stoch RSI double bottom
- Parallel channel support
- Falling wedge
I'm a buyer with tight tight tight stops.
All the Best from the Crypto Space
A quick chart on how I am monitoring BTC right now.
I see a lot of bullish signs on this red days, like we shall see a lot of bearish signs after several green days.
- RSI is bottomed
- Stoch RSI double bottom
- Parallel channel support
- Falling wedge
I'm a buyer with tight tight tight stops.
All the Best from the Crypto Space
Operación activa
That was quick :)Nota
Upward breakout of the falling wedgeMonitoring BTC reaction to $6,400 with tight stop loss
Nota
BTC bouncing on daily with SRSI oversold.
Exención de responsabilidad
La información y las publicaciones no constituyen, ni deben considerarse como, asesoramiento o recomendaciones financieras, de inversión, de trading u otro tipo, proporcionadas o respaldadas por TradingView. Obtenga más información en Condiciones de uso.
Exención de responsabilidad
La información y las publicaciones no constituyen, ni deben considerarse como, asesoramiento o recomendaciones financieras, de inversión, de trading u otro tipo, proporcionadas o respaldadas por TradingView. Obtenga más información en Condiciones de uso.