
I believe that it is possible to beat the market through a consistent and unemotional approach. This is primarily achieved through preparing instead of reacting. Click here to learn more about how I use the indicators below and Click here to get my complete trading strategy! Please be advised that I swing trade and will often hold onto a position for > 1 month. What you do with your $ is your business, what I do with my $ is my business.
My most recent Bitcoin Bubble Comparison led to the following predictions: 1 day - 14 days = < $5,750 | bottom prediction: $2,860 by 10/30
Previous analysis / position: “The market is starting to show serious signs of life and I am expecting a big move in this next week. During time likes these it is very important to be proactive and decisive when the moment of decision comes.” / Stopped out off positions during last night’s pump
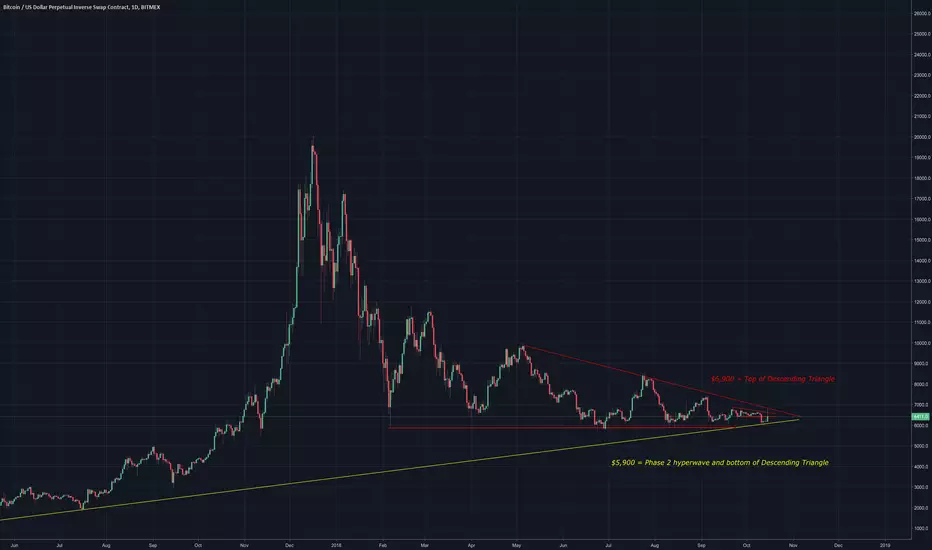
Patterns: Descending triangle
Horizontal support and resistance: Testing $6,350 for support | R: $6,600
BTCUSDSHORTS: I was expecting them to break out of the top of the triangle. Instead it found resistance and retested bottom end. Currently wicking off and creating another higher low.
Funding Rates: Longs pay shorts 0.01%
12 & 26 EMA’s (calculate % difference): Broke through them and quickly pulled back below
50 & 128 MA’s: 50: -2.79% | 128: -4.52%
Volume: Daily candle is shaping up for huge volume. Currently ~ 2X average and still eight hours left in the day
FIB’s: 0.5: $6,784 | 0.618: $6,631 | 0.786: $6,414
Candlestick analysis: Nasty wick on top shows bears in control
Ichimoku Cloud: Pump almost retested daily cloud
TD’ Sequential: Red 2 = Red 1 on the weekly, price flipping on other TF’s
Visible Range: Retested highest liquidity zone from past year and quickly found resistance.
BTC’ Price Spreadsheet: 12h: +2.91% | 24h: -2.51% | 1w: -3.12% | 2w: -0.34% | 1m: +5.36%
Bollinger Bands: Current candle tested top band and bottom band. Currently is below MA
Trendline: Pump found resistance at top of descending triangle (I adjusted my line slightly for a new best fit). Briefly brokethrough weekly MA, now back below
Daily Trend: Bull
Fractals: Pump failed to break weeky up fractal at $6,900
On Balance Volume: Testing down trend resistance on daily.
ADX: +DI crossing -DI is irrelevant since ADX is below 20
Chaikin Money Flow: Money flow did not increase with last pump and maybe even decreased
RSI (14 setting): Highest hourly RSI reading since July. Watching for divergences.
Stoch: Bullish recross on daily watching for another lower high
Summary: I do not know about you all but Bitcoin over the last month has been the hardest market that I have ever traded. Constantly flashing signs on high probability entries only to turn on a dime and whipsaw anyone with the gumption to take a position and use < 10% stop loss.
If nothing else, this should be a great lesson in risk management and resilience. I have gotten stopped out on no less than 10 trades in a row. With an average stop loss of 0 - 3% this has had a minimal effect on my bankroll. All I need to do is capitalize on one 10% move in the market - with 5:1 leverage - and I will more than make up for those losses.
With this approach it is possible to be wrong / stopped out 10/11 times and still turn a profit. It doesn’t take a genius to get it right less than 10% of the time, however it does take a certain level of stubborness / sticktoitiveness.
I was feel very good about my position last night as three out of three stop entries were in the green within minutes of triggering. I thought I had finally caught the train. I was wrong and it was very frustrating. However I am not going to let that stop me. Giving up after a losing streak or increasing position size / leverage is where most people go wrong.
USDT:USD fell to $0.85 and is currently sitting at $0.9258. The premium between Binance and Coinbase is currently 8.27%. This is not bullish, although seeing the higher prices may look that way. Once USDT' is done pilling into BTC’ then there should be a major correction.
Right now I am watching the charts and really hoping that we get another bounce to the $6,600 area for BTC’ and $210 for ETH’. If that happens then I am going to be taking out large positions.
I have outlined $198 and $188 as key areas of horizontal support to watch out for. If we do not pump to $210 then I will be looking to enter slightly below there with stop orders.
$6,400 and $6,150 are the key levels for BTC’.
My most recent Bitcoin Bubble Comparison led to the following predictions: 1 day - 14 days = < $5,750 | bottom prediction: $2,860 by 10/30
Previous analysis / position: “The market is starting to show serious signs of life and I am expecting a big move in this next week. During time likes these it is very important to be proactive and decisive when the moment of decision comes.” / Stopped out off positions during last night’s pump
Patterns: Descending triangle
Horizontal support and resistance: Testing $6,350 for support | R: $6,600
BTCUSDSHORTS: I was expecting them to break out of the top of the triangle. Instead it found resistance and retested bottom end. Currently wicking off and creating another higher low.
Funding Rates: Longs pay shorts 0.01%
12 & 26 EMA’s (calculate % difference): Broke through them and quickly pulled back below
50 & 128 MA’s: 50: -2.79% | 128: -4.52%
Volume: Daily candle is shaping up for huge volume. Currently ~ 2X average and still eight hours left in the day
FIB’s: 0.5: $6,784 | 0.618: $6,631 | 0.786: $6,414
Candlestick analysis: Nasty wick on top shows bears in control
Ichimoku Cloud: Pump almost retested daily cloud
TD’ Sequential: Red 2 = Red 1 on the weekly, price flipping on other TF’s
Visible Range: Retested highest liquidity zone from past year and quickly found resistance.
BTC’ Price Spreadsheet: 12h: +2.91% | 24h: -2.51% | 1w: -3.12% | 2w: -0.34% | 1m: +5.36%
Bollinger Bands: Current candle tested top band and bottom band. Currently is below MA
Trendline: Pump found resistance at top of descending triangle (I adjusted my line slightly for a new best fit). Briefly brokethrough weekly MA, now back below
Daily Trend: Bull
Fractals: Pump failed to break weeky up fractal at $6,900
On Balance Volume: Testing down trend resistance on daily.
ADX: +DI crossing -DI is irrelevant since ADX is below 20
Chaikin Money Flow: Money flow did not increase with last pump and maybe even decreased
RSI (14 setting): Highest hourly RSI reading since July. Watching for divergences.
Stoch: Bullish recross on daily watching for another lower high
Summary: I do not know about you all but Bitcoin over the last month has been the hardest market that I have ever traded. Constantly flashing signs on high probability entries only to turn on a dime and whipsaw anyone with the gumption to take a position and use < 10% stop loss.
If nothing else, this should be a great lesson in risk management and resilience. I have gotten stopped out on no less than 10 trades in a row. With an average stop loss of 0 - 3% this has had a minimal effect on my bankroll. All I need to do is capitalize on one 10% move in the market - with 5:1 leverage - and I will more than make up for those losses.
With this approach it is possible to be wrong / stopped out 10/11 times and still turn a profit. It doesn’t take a genius to get it right less than 10% of the time, however it does take a certain level of stubborness / sticktoitiveness.
I was feel very good about my position last night as three out of three stop entries were in the green within minutes of triggering. I thought I had finally caught the train. I was wrong and it was very frustrating. However I am not going to let that stop me. Giving up after a losing streak or increasing position size / leverage is where most people go wrong.
USDT:USD fell to $0.85 and is currently sitting at $0.9258. The premium between Binance and Coinbase is currently 8.27%. This is not bullish, although seeing the higher prices may look that way. Once USDT' is done pilling into BTC’ then there should be a major correction.
Right now I am watching the charts and really hoping that we get another bounce to the $6,600 area for BTC’ and $210 for ETH’. If that happens then I am going to be taking out large positions.
I have outlined $198 and $188 as key areas of horizontal support to watch out for. If we do not pump to $210 then I will be looking to enter slightly below there with stop orders.
$6,400 and $6,150 are the key levels for BTC’.

emasar Indicator is available for purchase at alphanalysis.io/product/emasar/
Exención de responsabilidad
La información y las publicaciones no constituyen, ni deben considerarse como, asesoramiento o recomendaciones financieras, de inversión, de trading u otro tipo, proporcionadas o respaldadas por TradingView. Obtenga más información en Condiciones de uso.
emasar Indicator is available for purchase at alphanalysis.io/product/emasar/
Exención de responsabilidad
La información y las publicaciones no constituyen, ni deben considerarse como, asesoramiento o recomendaciones financieras, de inversión, de trading u otro tipo, proporcionadas o respaldadas por TradingView. Obtenga más información en Condiciones de uso.