
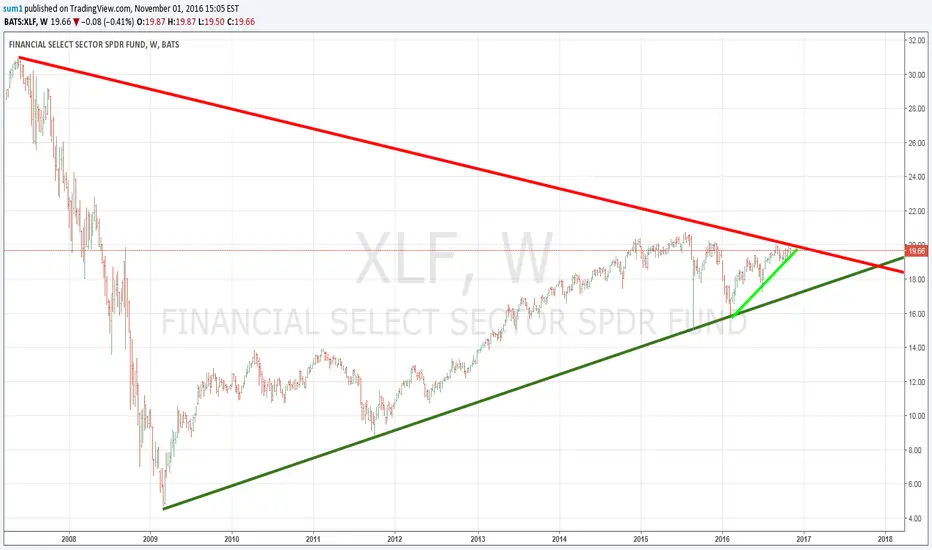
XLF time 2 short. From 2007 May high to 2016 October high the red line is the resistance.
From 2009 MArch low till 2016 feb low is green line acting as support. But even DOWJONES, SPY AND NASDAQ MADE SOME NEW HIGHS BUT XLF failed to do so. Means technically its weak. So time to short :)
From 2009 MArch low till 2016 feb low is green line acting as support. But even DOWJONES, SPY AND NASDAQ MADE SOME NEW HIGHS BUT XLF failed to do so. Means technically its weak. So time to short :)

Publicaciones relacionadas
Exención de responsabilidad
La información y las publicaciones no constituyen, ni deben considerarse como, asesoramiento o recomendaciones financieras, de inversión, de trading u otro tipo, proporcionadas o respaldadas por TradingView. Obtenga más información en Condiciones de uso.
Publicaciones relacionadas
Exención de responsabilidad
La información y las publicaciones no constituyen, ni deben considerarse como, asesoramiento o recomendaciones financieras, de inversión, de trading u otro tipo, proporcionadas o respaldadas por TradingView. Obtenga más información en Condiciones de uso.