Largo
XLM Bullish Flag
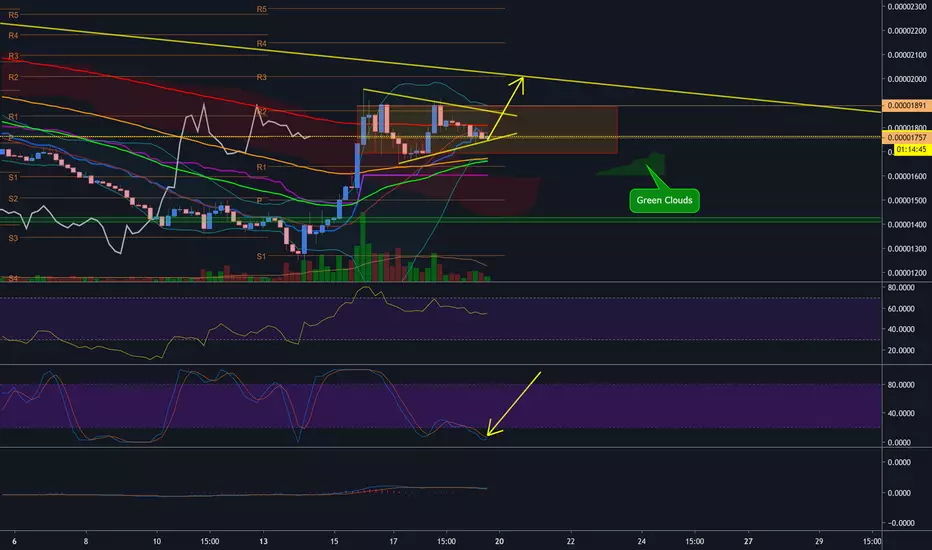
don't miss this Flag to 2000 Sats.
All in Graph.
Stop Loss under 1690 Sats.
all in Graph.
Happy Tr4Ding !
All in Graph.
Stop Loss under 1690 Sats.
all in Graph.
Happy Tr4Ding !
Nota
This Trade is still in play but have to adjust it because XLM broked down triangle. we have a double support on EMA50 and EMA100 around 1680Sats.
Stop Loss under EMAs 1640ish.
Operación cerrada: precio stop alcanzado
Bears still here so if it breaks under 1640 i suggest to rebuy around 1605 (green ichimoku flat area ). Also Keep have a look on 4H RSI for a test rebuy in the green area. XLM still bullish for a long term invest so nothing to worry.
Nota
Fibo 4HNota
Patience is the key. MACD Divergence.
Exención de responsabilidad
La información y las publicaciones no constituyen, ni deben considerarse como, asesoramiento o recomendaciones financieras, de inversión, de trading u otro tipo, proporcionadas o respaldadas por TradingView. Obtenga más información en Condiciones de uso.
Exención de responsabilidad
La información y las publicaciones no constituyen, ni deben considerarse como, asesoramiento o recomendaciones financieras, de inversión, de trading u otro tipo, proporcionadas o respaldadas por TradingView. Obtenga más información en Condiciones de uso.