
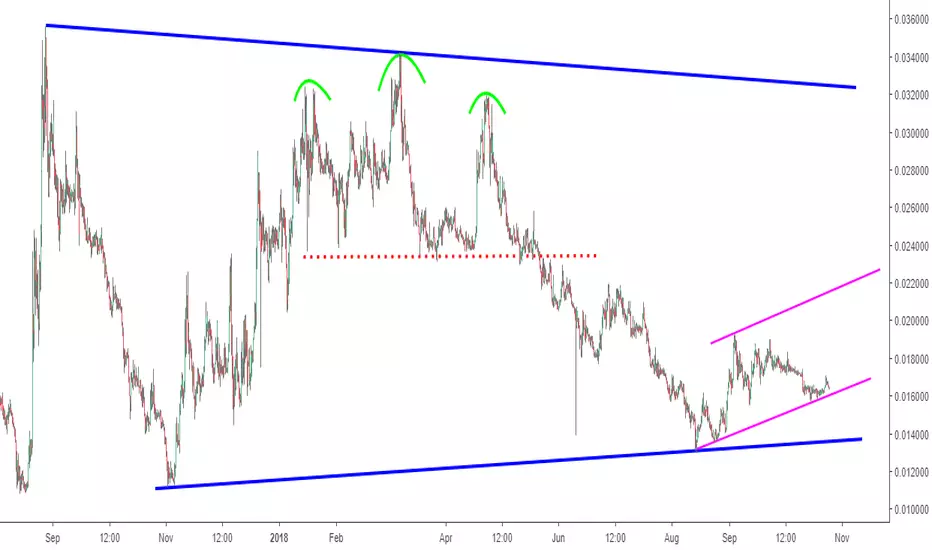
The 6 hour timeframe of XMRBTC (Monero) captures over a year and 2 months of price action.
The sideways price movement is best described in this analysis as a symmetrical triangle, with extremes of the chart pattern i.e. support and resistance indicated by the dark blue lines.
The most recent uptrend starting August 15, 2018 is described using a bullish channel that is tentative. A break below the channel, and also support at 0.015469 could result in price action reaching 0.013192 or lower.
A break above the channel however at 0.022360 could see the price action test resistance at 0.032487.
The sideways price movement is best described in this analysis as a symmetrical triangle, with extremes of the chart pattern i.e. support and resistance indicated by the dark blue lines.
The most recent uptrend starting August 15, 2018 is described using a bullish channel that is tentative. A break below the channel, and also support at 0.015469 could result in price action reaching 0.013192 or lower.
A break above the channel however at 0.022360 could see the price action test resistance at 0.032487.

Publicaciones relacionadas
Exención de responsabilidad
La información y las publicaciones no constituyen, ni deben considerarse como, asesoramiento o recomendaciones financieras, de inversión, de trading u otro tipo, proporcionadas o respaldadas por TradingView. Obtenga más información en Condiciones de uso.
Publicaciones relacionadas
Exención de responsabilidad
La información y las publicaciones no constituyen, ni deben considerarse como, asesoramiento o recomendaciones financieras, de inversión, de trading u otro tipo, proporcionadas o respaldadas por TradingView. Obtenga más información en Condiciones de uso.