
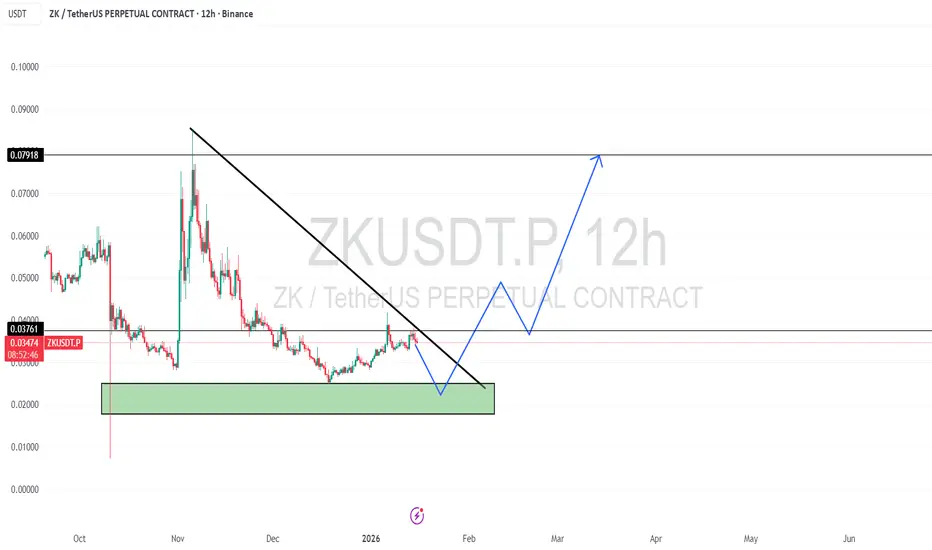
📌 $CFI:ZK Technical Analysis: The market has recently experienced a massive price dump, sliding from approximately $0.084 down to the $0.025 - $0.035 range. While the long-term trend remains weak, we are seeing signs of stabilization near historical lows.
📌 The Path to Bullish Confirmation: To see a sustainable move toward the upside, the following three technical conditions must be met:
Touch the Support Zone: The price needs to drop and interact with the primary Green Support Zone to find necessary liquidity.
Hold the Support: Buyers must step in and prevent the price from closing below this zone on the daily candle.
Breakout Trendline: A decisive breakout above the long-term descending trendline is required to shift the market structure from bearish to bullish.
📌 Indicator Check (1D Timeframe):
Relative Strength Index (RSI): Currently sitting in the neutral zone. This is healthy as it shows there is no immediate "overbought" pressure, leaving plenty of room for a price rally once a breakout occurs.
Moving Averages: The 50-day SMA is currently sloping upward and acting as a potential dynamic support. However, the 200-day SMA is still positioned above the current price, acting as a major long-term resistance that bulls need to reclaim.

Join My Free Signal Channel ➡ t.me/Leo524
Join For More Indicators ➡ t.me/leoindicators
Join For More Indicators ➡ t.me/leoindicators
Exención de responsabilidad
La información y las publicaciones no constituyen, ni deben considerarse como, asesoramiento o recomendaciones financieras, de inversión, de trading u otro tipo, proporcionadas o respaldadas por TradingView. Obtenga más información en Condiciones de uso.
Join My Free Signal Channel ➡ t.me/Leo524
Join For More Indicators ➡ t.me/leoindicators
Join For More Indicators ➡ t.me/leoindicators
Exención de responsabilidad
La información y las publicaciones no constituyen, ni deben considerarse como, asesoramiento o recomendaciones financieras, de inversión, de trading u otro tipo, proporcionadas o respaldadas por TradingView. Obtenga más información en Condiciones de uso.