
Zydus Lifesciences – Weekly Breakout Watch, Targeting 1,200
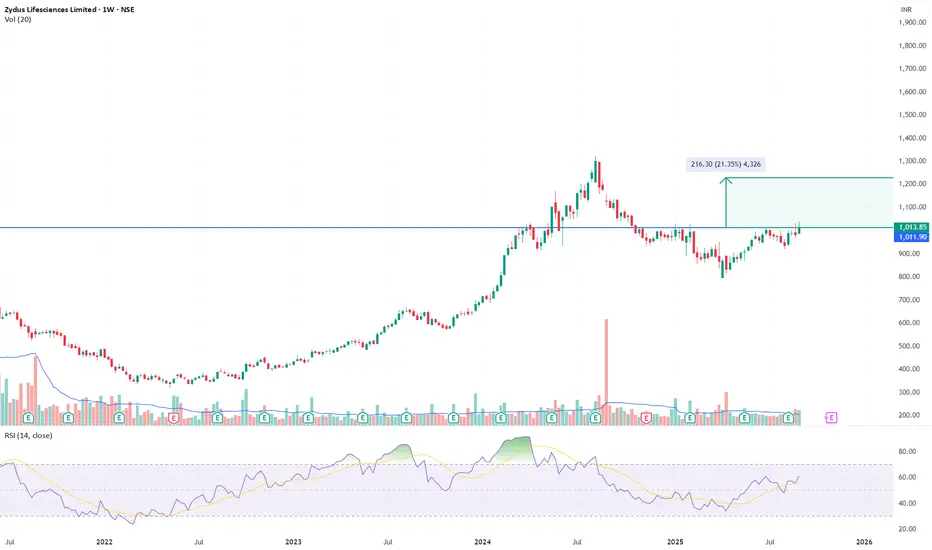
Chart Context (Weekly)
Setup
Levels
Bias: Medium-term swing; breakout confirmation needed for follow-through.
Disclaimer: This analysis is for educational purposes only and does not constitute investment advice. Please do your own research or consult a financial advisor before making trading or investment decisions.
- Multi-year horizontal resistance around 1,020 tested repeatedly since 2022.
- Strong weekly candle now approaching this zone with above-average volume (7.15M vs 5.01M).
- RSI climbing ~60, momentum building without overbought conditions.
Setup
- Base formation since late 2024 after a deep correction.
- Breakout above 1,040 on a weekly close confirms structural reversal.
- Measured move from base points to ~1,200 (~20% upside).
Levels
- Breakout trigger: Weekly close > 1,040.
- Upside potential: 1,150–1,200.
- Risk management: Structure invalid below 960.
Bias: Medium-term swing; breakout confirmation needed for follow-through.
Disclaimer: This analysis is for educational purposes only and does not constitute investment advice. Please do your own research or consult a financial advisor before making trading or investment decisions.
Operación cerrada: precio stop alcanzado

Exención de responsabilidad
La información y las publicaciones no constituyen, ni deben considerarse como, asesoramiento o recomendaciones financieras, de inversión, de trading u otro tipo, proporcionadas o respaldadas por TradingView. Obtenga más información en Condiciones de uso.
Exención de responsabilidad
La información y las publicaciones no constituyen, ni deben considerarse como, asesoramiento o recomendaciones financieras, de inversión, de trading u otro tipo, proporcionadas o respaldadas por TradingView. Obtenga más información en Condiciones de uso.