Dot Target why 20$ KUCOIN:DOTUSDT BINANCE:DOTUSDT BINANCE:DOTUSDT.P CRYPTOCAP:DOT
---
### **1. Fibonacci Retracement Analysis**
- **Levels Observed**:
- **0% (High)**: **55.081** (all-time high or recent significant high).
- **0.236**: **42.594**.
- **0.5**: **28.625** (midpoint of retracement).
- **0.618**: **22.381**.
- **0.65**: **20.688** (golden pocket).
- **0.786**: **13.491**.
- **1.0 (Low)**: **2.168** (all-time low or recent significant low).
---
### **2. Current Price**
- The
Bearish Bat
Price rengeBAT/USDT Chart:
Trend: Uptrend Price above moving average (yellow line).
Support: Green zone
Around 0.2317.
Resistance: Red zone Around 0.3778.
Possible Strategy:
Buy: Breaked EMA snd firs resistance
Sell: If price fails to break resistance
Note: Always consider market new and overall trends.
GBP/NZD Hits Highest Level Since 2016: Is a Move Down Ahead?The GBP/NZD is currently testing its highest price in recent years, nearing the significant resistance level of 2.1900. This area has served as a notable barrier since 2016 and often sees increased selling interest. The price action in this zone, combined with the emergence of a harmonic pattern, suggests a potential reversal or correction. Furthermore, recent price movements, particularly the candles from October 30 and 31 breaking below the low of October 29, indicate rising bearish momentum,
GShort
USD/CHF Bearish Setup: Technical Analysis & Trade OpportunityPattern Formation: Bearish Bat Harmonic Pattern:
The USD/CHF is currently forming a Bearish Bat Harmonic Pattern, which suggests a potential reversal to the downside. The pattern is nearing completion at a key resistance level, providing a strong setup for a bearish entry.
Key Resistance and Fibonacci Confluence:
The pair has received a significant rejection from a crucial resistance zone, which aligns precisely with the 0.786 Fibonacci retracement level. This confluence strengthens the bea
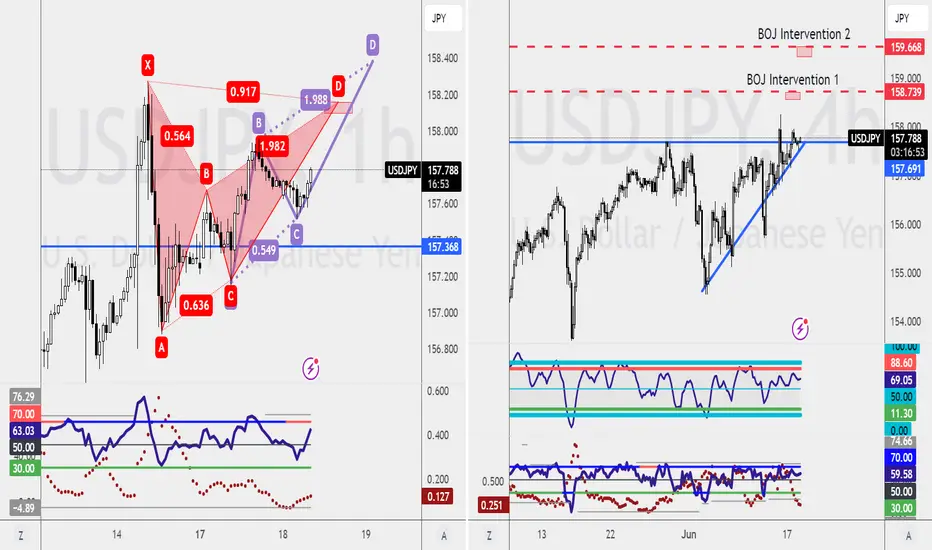
USDJPY Analysis and Trade OpportunitiesLike I mentioned in our weekend live session, I don't see any BOJ intervention happening soon.
The earliest I’m looking is when the market reaches 158.73, with the next level at 159.66.
Around 157.74 is the level I'll be looking for a buying opportunity using the existing strategy that I've used for many years.
Key Levels:
Potential Intervention Levels :
- 158.73
- 159.66
- Buying Opportunity : Around 157.74
Shorting Opportunities :
1-Hourly Chart :
- Bearish Bat Pattern Completion
EURUSD Bearish Trend and Bearish Bat Pattern CompletionEURUSD Bearish Trend and Bearish Bat Pattern Completion
Instrument: EUR/USD
Timeframe: 1-Hourly Chart
Current Direction: Bearish
Analysis:
EUR/USD is currently exhibiting a bearish trend. While the impulse to short immediately is strong, my preferred entry level is at 169.54. This price point aligns with the completion of a bearish bat pattern on the 1-hourly chart.
Key Points:
- Bearish Trend: The overall trend for EUR/USD is downwards.
- Bearish Bat Pattern: Completion level at 169.54,
EURUSD: A Sideway Consolidation with Bearish SignalsEURUSD is currently showing a sideway consolidation on the weekly chart, but the daily chart is painting a different picture:
- Bearish Fib-3 Bat pattern with RSI Divergence
I'm eyeing two potential entry points on the 1-hourly chart:
1. Resistance retest at 1.0852
2. Type 2 retest of the Bearish Bat Pattern at 1.0879
What's your take on this setup? Share your trade plans and thoughts in the comments!
Understanding Bearish and Bullish Bat Harmonic Patterns
Understanding Bearish and Bullish Bat Harmonic Patterns: A Professional Guide for Traders
In the dynamic world of trading, identifying potential reversal points is crucial for making informed decisions. Two powerful tools that professional traders often rely on are the Bearish and Bullish Bat Harmonic Patterns. These patterns, grounded in Fibonacci ratios, offer insights into market behavior and help in predicting price movements. This article delves into the intricacies of these patterns, p
USDJPY Short Opportunity: Key Factors and Strategic EntryHello, traders!
I’m on standby to short the USDJPY, and here's why this setup is compelling. This analysis covers two crucial parts, providing context and strategic entry points.
Part One: Macro Fundamentals
1. China’s Treasury Offload :
- China sold $53.3 billion of Treasuries and agency bonds in Q1 2024. This reduction in US dollar assets can impact USDJPY negatively.
2. BRICS Currency Moves :
- BRICS countries are trading $4 billion in local currencies, sidelining the US dollar. Thi
SPX Showing Signs of Weakness at PCZ of a Bearish Alternate BatThe RSI on the daily has begun to rollover as the SPX appears to have rejected off of the Bearish Alternate Bat HOP level. There does not appear to be much nearby support within the range the SPX is currently trading in so if it gets back below the previous All-Time High I could see it coming back down to around $5100 maybe even $5000 - $4800. This all seems to be brought on by the increase in JGB Yields disrupting the Carry Trade. We may see them try to stabilize the carry trade around $5100 bu
#BAT/USDT#BAT
The price is moving in a triangle on a 12-hour frame, which it adheres to perfectly.
We have a major support area at the 0.2500 level.
We have stability above moving average 100.
We have a downtrend on the RSI indicator that supports the rise and is about to break higher
Entry price is 0.300
The first target is 0.3200
The second target is 0.3500
The third target is 0.3790
Bitcoin Analysis: Potential Resistance AheadOverview:
Bitcoin (BTC/USD) is approaching a key resistance level at $72,295, which could impact its near-term price action. Here's a breakdown of the current analysis and potential trading opportunities.
Technical Analysis:
- Resistance Level: Bitcoin is approaching a significant resistance level at $72,295.
- 4-Hourly Chart: A close above this level could indicate further upside potential, with the next resistance at $73,785.
- Buying Opportunities: Potential buying opportunities exist
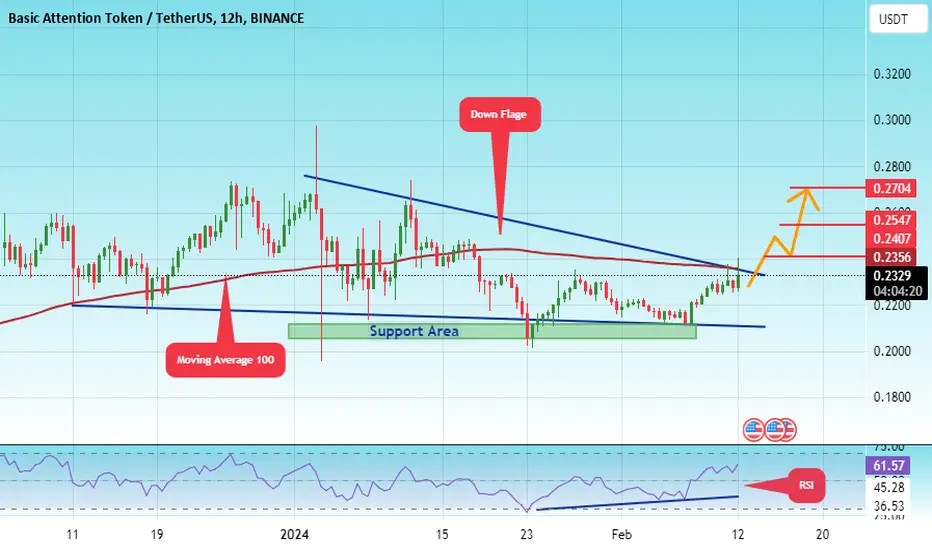
#BAT/UST#BAT
The price is moving in a bearish flag on the 12-hour frame
We also have a good penetration and therefore we seek stability
above moving average 100
We have a major support area at the 0.2100 level
We have a positive divergence on RSI
Entry area 0.2330
The first target is 0.2356
The second target is 0.2547
The fourth target is 0.2704
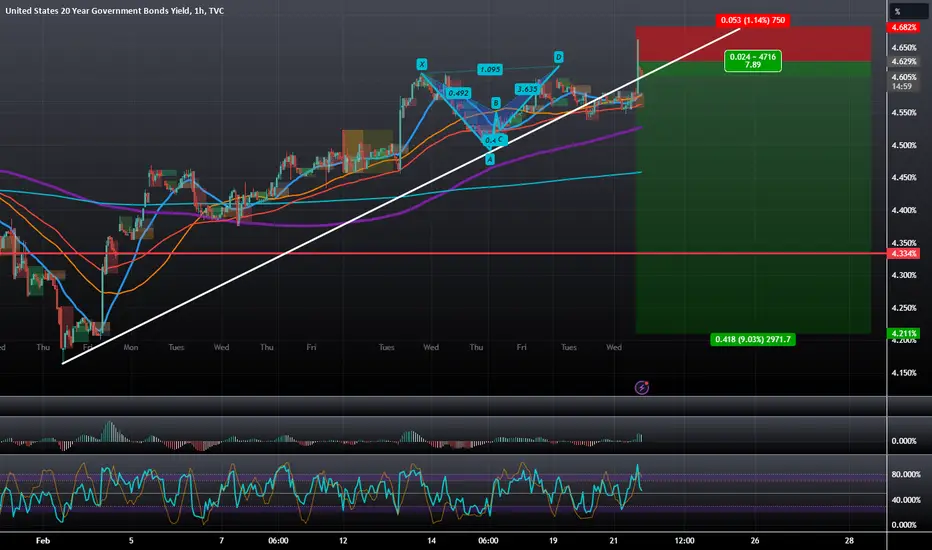
US 20 Year Yield: Bearish Harami at Bearish Bat PCZThere is a Bearish Harami at the HOP level of a Bearish Bat with Impulsive RSI BAMM Confirmation. Alongside that, we also have 2 Major Squareups significantly below the current level and also an unfilled gap. If these Bearish Signals at the highs are to play along, this should be the start of an even greater retrace to fill the downside gap and to complete the square ups. This would likely come with some Bearishness in DXY and upside in the TLT which may also spillover into the IEF.
The Duality of PatternsEURJPY presents an interesting scenario with a potential combo trade, or is it? Let's break it down:
1. 4-Hourly Bearish ABCD Pattern:
- Retest completion at 161.74.
2. Daily Bearish Bat Pattern:
- Completion at 162.55.
Two patterns, two different starting points. Is it a combo or a dual setup?
Share your thoughts and let's navigate this intriguing trade opportunity together!
Potential Head and Shoulders & Early Trading OpportunitiesUSDJPY is showing promise with a potential Head and Shoulders pattern on the Weekly Chart. Here's the game plan:
1. Awaiting Bearish Shark Pattern Confirmation on Daily Chart:
- Patient approach for a comprehensive setup.
2. Early Trading Opportunities on 15-Minutes Chart:
- Spotted Bearish Bat and Bearish Gartley Patterns.
- Potential for quicker engagements on shorter timeframes.
Stay vigilant and let's discuss your insights on this evolving USDJPY scenario!
Waiting for ConfirmationIf you're seeking shorting opportunities on EURUSD, I've got two potential setups for you.
Remember, always wait for candlestick pattern confirmation before making your move.
Bearish Shark Pattern: Look out for completion at 1.0917.
Bearish Bat Pattern: This setup is more intriguing to me, as the Potential Reversal Zone (PRZ) aligns with the bearish trendline.
Be patient and let the market confirm the patterns. Share your thoughts and trade plans on EURUSD below!
Exploring OpportunitiesGiven the current consolidation phase in the market, I'm open to exploring various trading opportunities this week.
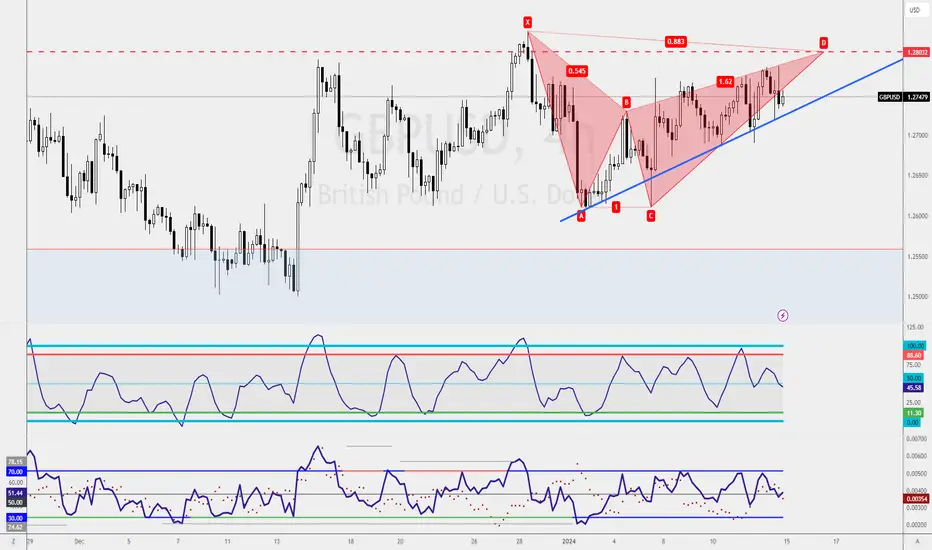
For counter-trend traders eyeing a shorting opportunity, the completion of a Bearish Bat Pattern at 1.2803 is a crucial level to watch.
Alternatively, for those in search of a buying opportunity, a retest on the trendline, conveniently aligned with the 1-hourly chart, could provide an entry point.
What's your strategy for GBPUSD? Share your insights!
Potential Short Opportunity on Bearish PatternsDespite GBPUSD demonstrating a Weaker Bull Trading setup, my analysis suggests a more bullish outlook compared to EURUSD.
However, I'm currently eyeing a shorting opportunity on a lower timeframe. The emergence of a Bearish Gartley Pattern retesting at 1.2752 or a completion of a Bearish Bat Pattern around 1.2803 appears promising for a potential short position.
What are your thoughts or trade plans for GBPUSD?
Share your insights below!
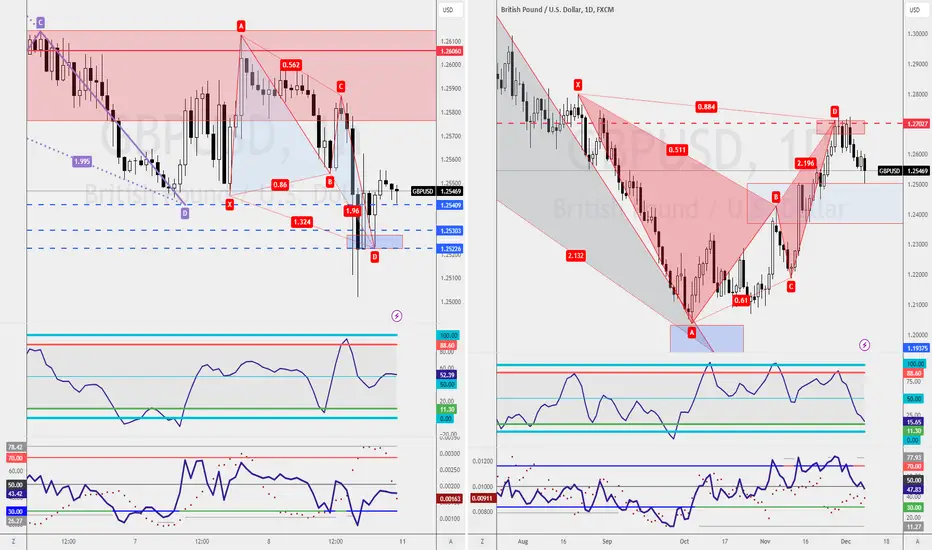
Balancing Bullish Signals And Counter-Trend StrategiesGBPUSD showcases a Bearish Bat pattern on the daily chart, signaling a potential shorting opportunity with a likely retest around 1.2691.
Another approach would be to watch for resistance retesting, aiming for a double top with RSI divergence at 1.2606 on the 1-hourly chart.
However, if you're leaning towards a buying opportunity, considering the Weaker Bull trading setup on the weekly chart, the 1-hourly chart reveals a Bullish Butterfly Pattern.
Keep an eye out for a retest around 1.2522