AIRR — Bullish Cypher + Elliott Wave ABC CorrectionAIRR is approaching an important confluence zone between $98.50 and $100.00, where the Bullish Cypher Potential Reversal Zone lines up with the projected completion of an Elliott Wave ABC correction.
Price has been moving lower inside a corrective channel, which gives the current decline the structure of a possible ABC correction. What makes this setup interesting is that the projected Wave C is ending near the PRZ, while the 1:1 extension from Wave A to Wave C also lines up with this same area
Bullish Cypher
SMR: Bullish Cypher Setting Up on the Weekly ChartSMR is approaching an interesting area on the weekly chart, where a Bullish Cypher Harmonic Pattern is completing.
This chart is plotted on a LOG SCALE, which is important when looking at the larger price targets and percentage moves.
The Setup
The Potential Reversal Zone (PRZ) is around the $3 mark
If price reacts positively from this area, I’ll be watching for a bullish reversal and confirmation that the Cypher is working.
Entry: Around $3-3.50.
Invalidation: Below $1.88
Upside Targets
Pfizer’s Cypher Setup: The Yellow Trend Line Could Hold the Key Pfizer is approaching one of the most technically important areas on its long-term monthly chart.
The setup is built around a bullish Cypher harmonic pattern, with the projected completion occurring inside a major potential reversal zone around the $17.50 area. But the harmonic pattern is only part of the story.
The real significance of this chart may be the long-term yellow trend line.
## The Yellow Trend Line: A Decades-Long Technical Battlefield
The yellow trend line is not simply another
BTCUSD: Bullish Gartley Support Confirmed Targeting $155,627.72This is a follow-up to the previous bullish entry idea from 2 months ago at the bottom of the channel.
Over the last several weeks BTC has been putting in a bottom at the bottom of this channel both in terms of putting in a Double Bottom on the weekly timeframe and confirming a Bullish Inverted Hammer on last month's Monthly Close; in this time BTC has been taking back the 200-week moving average and given that BTC rarely stays below the 200-week Moving Average for long it is statistically li
Bullish 2021 Bitcoin Fractal Suggests Bitcoin has BottomedBitcoin is sitting at the PCZ of a what can be plotted as both a Bullish Cypher and a Bullish gartley and on the 5D timeframe it is below the 200 Period SMA which it usually doesn't stay below for long; and is also sitting a the 1.618 Standard Deviation demand line of a Linear regression Channel while exhibiting Bullish Divergence on the MACD and starting to show a second recovery from oversold zones in the RSI after what was a sharp secondary decline into oversold zones and lastly on the price
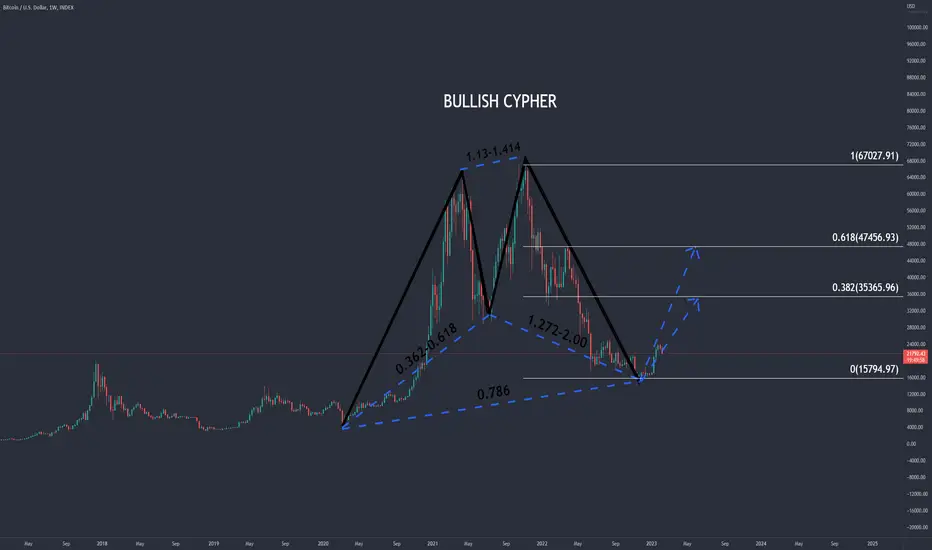
BTC BULLISH CYPHERStructure of the Cypher Pattern
A valid bullish Cypher follows this sequence:
X → A: Strong impulsive rally
A → B: Deep retracement (typically 0.382–0.618 of XA)
B → C: Expansion beyond point X (usually 1.272–1.414 XA)
C → D: Final retracement to 0.786 of XC, where reversal is expected
Your chart aligns perfectly with this geometry.
Key Fibonacci Validation on the Chart
From the visual levels shown:
0.382 retracement: ~96,788
0.5 retracement: ~87,673
0.618 retracement: ~78,558
0.786
Bitcoin Cup and Handle?Owhooooo!
This weekly chart has me howling for the moon!
It seems like the Bullish Cypher is still playing out, and the giant Cup and Handle formation could be in play. If we do see a pullback, I think this would fit nicely into the overall continuation of the Bullish Cypher trend.
So I'll be looking for this pullback to form the handle, and my own personal strategy is to use this (if it happens) to accumulate MORE Bitcoin.
I'll be hiding in the bushes and waiting to see how this plays ou
Raising EURUSD Profit Target to $1.114 due to a Bullish CypherDue to the apparent formation of a Bullish Cypher on the Daily, combined with the Bullish Push as confirmation on the RSI, and the strong push push in price action above the 200-day SMA, I will be raising my profit target for the EURUSD to the 100% retrace up at $1.114 as the 100% retrace would be the standard target for a Cypher and the TLT has outperformed which is usually a signal for psoitive price action in the EURUSD.
AMP Bullish harmonic cypher showing potential price outbreakHello
Today I bring you a harmonic cypher showing bullish signs on AMP.
A typical harmonic cypher pattern is bullish IF:
The initial leg, the XA leg, rallies higher from the starting point at X.
The AB leg moves lower to retrace the XA leg. This retracement should bring prices to between the 38.2 to 61.8 percent level of the XA leg.
The BC leg moves higher and takes out the swing high at point A, and terminating between the 127.2 and 141.4 projection of the initial XA leg.
The CD leg
Rollover Parralel channel updateUpdate of the previous parralel channels post .
So far both our channels have played out well, apart from the retest and rejection from our green channel.
If the red channel plays out like the others we should start to see a steeper decline from this point on. 🤞
This would also fit the narrative of the cypher harmonic Iv been watching for (see other posts on my profile)
Any questions or if you don't agree please comment and let me know. Love a discussion
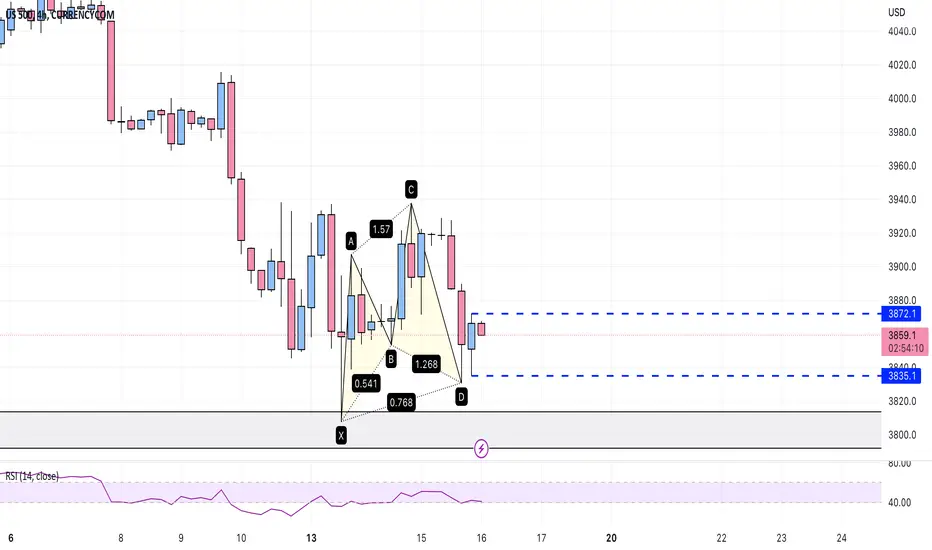
Cypher Completeif the next 4 hour candle is inside bar up, bullish continuation.
TP1: 3896
TP2: 3925
Stop Loss: 3830
Good Luck
ULong
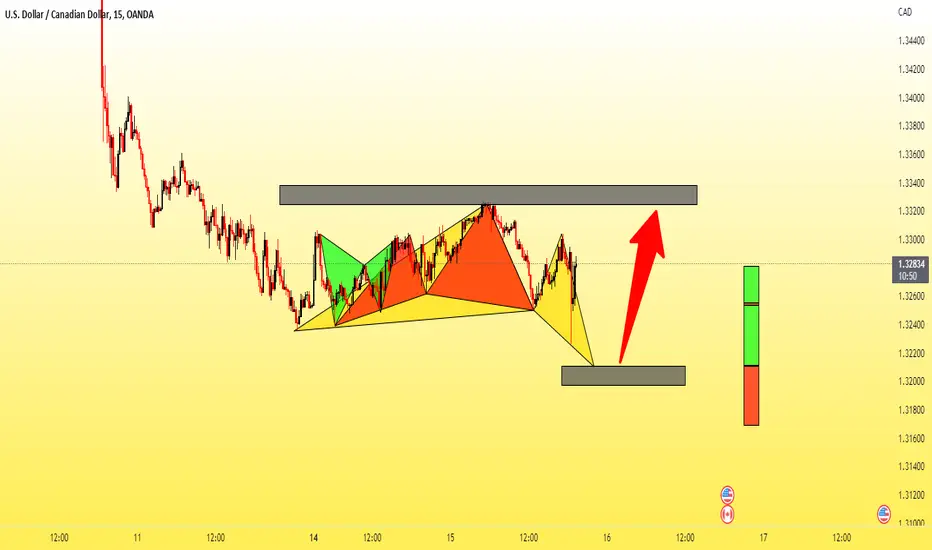
USDCHF Long Position: Bullish WaveUSDCHF is ready to go bull.
I am anticipating a Motive Wave on the up-side.
Because of how it started, I am expecting an Ending Diagonal in Intermediate (C)(turquoise).
GOLD (XAUUSD), EURUSD, USDJPY and DXY are all showing Reversal Patterns.
Time to trade Wave Jedi!
My Swissie Technicals:
* Ending Diagonal in Intermediate (C) (red)
* Flat Correction in Intermediate (B)(turquoise)
* Hidden Bullish Divergence
* Harmonic Pattern: Bullish Cypher in Minute b (white)
* Triple Bottom Pattern
* 88.6%
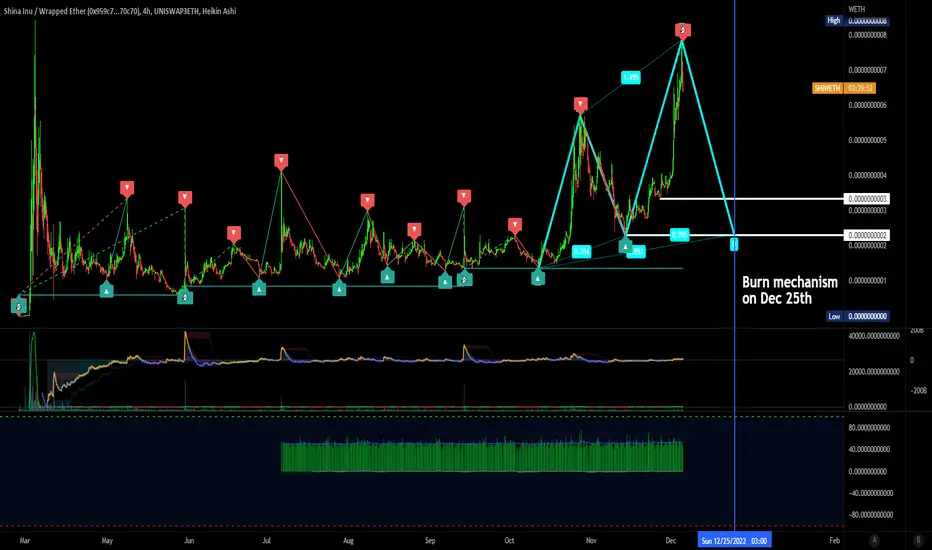
$SHIWETH Shina InuSHI Price Live Data
The live Shina Inu price today is $8.05e-7 USD with a 24-hour trading volume of $1,075,646 USD. We update our SHI to USD price in real-time. Shina Inu is down 2.27% in the last 24 hours. The current CoinMarketCap ranking is #2732, with a live market cap of not available. The circulating supply is not available and a max. supply of 20,000,000,000,000 SHI coins.
If you would like to know where to buy Shina Inu at the current rate, the top cryptocurrency exchanges for trading i
SLong
ARUSD: Bearish 3 Line Strike and a Close Above the 0.786 RetraceArweave today has simultaneously closed above the 0.786 retrace and has taken out the last 3-4 Days of Bearish Price Action on the Daily Timeframe.
We may also be at the PCZ of some sort of Deep Cypher Pattern; it can't be a Shark because the 1.618 Extension is nowhere near being reached so i think it's a Deep Cypher.