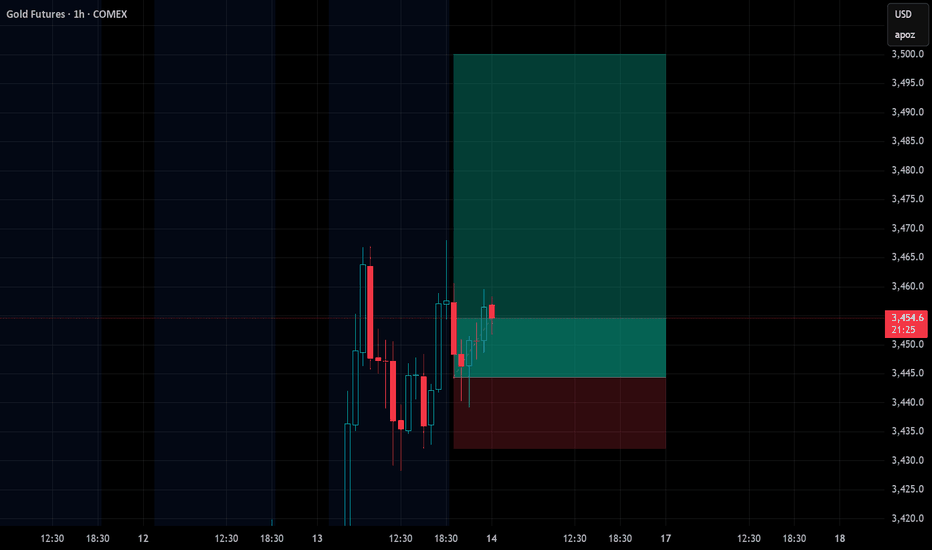
XAUUSD: Holding Above EMA200 โ But MSS Candidate Lurkingโ STRUCTURE
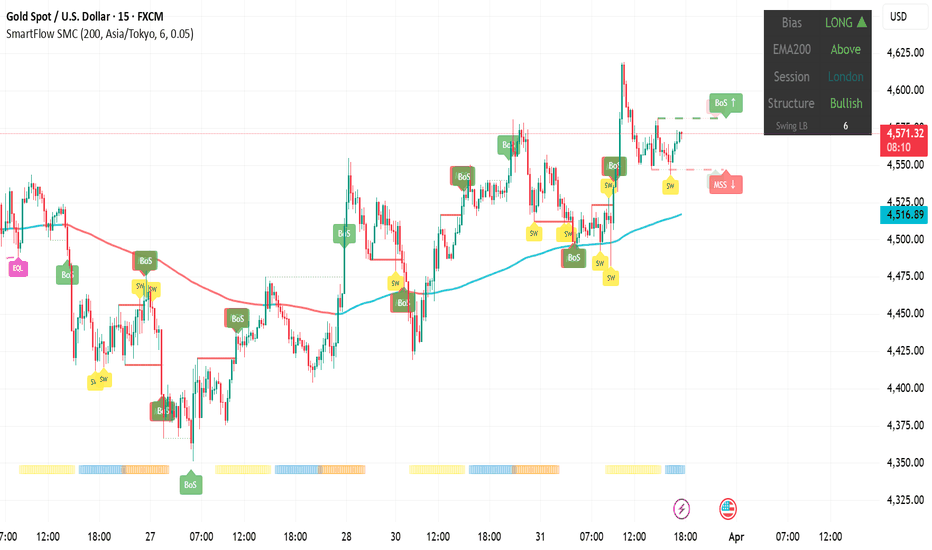
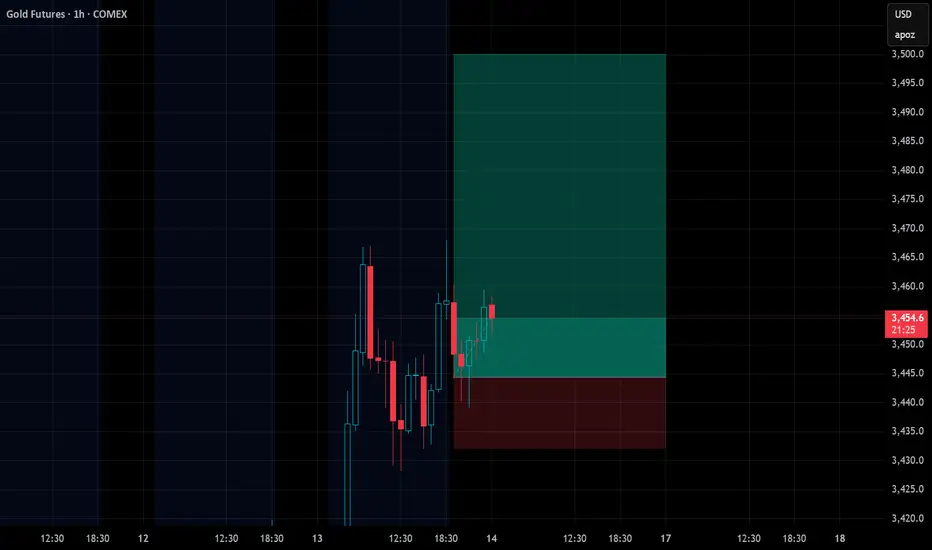
Gold continues to hold above EMA200 โ now 4 consecutive days. LONG/Above/Bullish at $4,568 during London session.
The rally from $4,350 to $4,625 earlier today was strong, with bullish BoS stacking all the way up. But the pullback from $4,625 to $4,568 is worth watching โ an MSS candidate (โ) has appeared on the right side of the chart, meaning a bearish reversal would trigger if price breaks below the recent swing low.
EMA200 (cyan ~$4,515) is now acting as support for the first time in the entire correction. Price is $50 above it. This is the longest sustained period above EMA200 since the crash began on Mar 13.
โ KEY LEVELS
Resistance: $4,600-4,625 (today's high, recent BoS)
Support: $4,515 (EMA200 โ the line that matters)
Support: $4,480-4,500 (previous structure)
MSS trigger: If price breaks below ~$4,540 โ structure flips bearish
โ WHAT TO WATCH
The MSSโ candidate is the key signal to monitor. As long as it remains unbroken, bullish structure holds. A bounce from $4,540-4,550 area with a new bullish BoS would confirm the uptrend.
If the MSS fires and price drops back below EMA200 ($4,515) โ back to the familiar pattern of failed bounces.
4 days above EMA200 is the strongest bullish signal since the correction started. The burden of proof has shifted โ bears need to prove a reversal, not bulls.
Not financial advice. For educational purposes only.
Exponential Moving Average (EMA)
XAUUSD: EMA200 Reclaimed โ First Time in 3 Weeks. Is Crash Over?This analysis uses SmartFlow SMC (Free) โ auto-detects BoS, MSS, EQH/EQL, BSL/SSL, and Sweeps. No repainting. Community Scripts. Pro version with FVG, OB, OTE, Confluence, and Alerts coming soon.
โโโโโโโโโโโโโโโโโโโโโโโโโโโโโโโโโโโโโโโ
โ THE MILESTONE
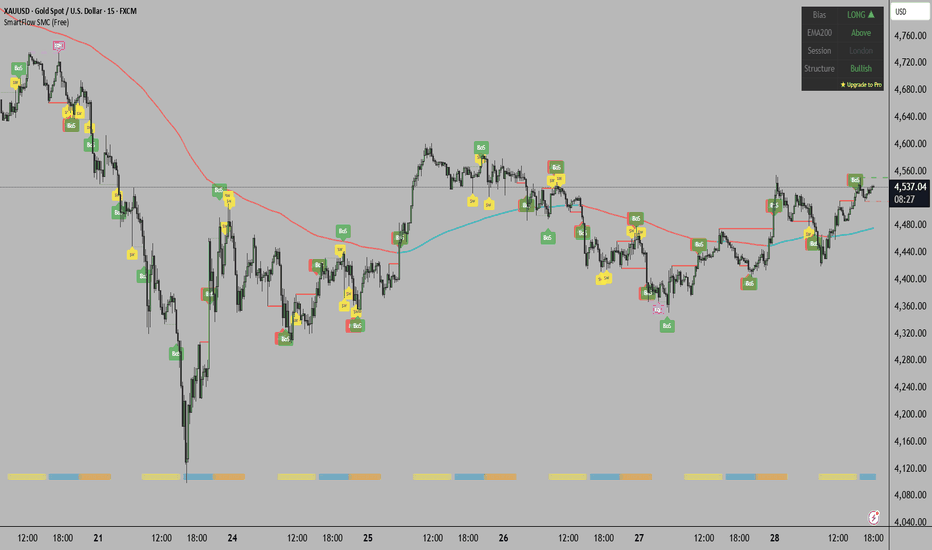
For the first time since the crash began on Mar 13, SmartFlow is showing:
Bias: LONG โฒ
EMA200: Above
Structure: Bullish
All three aligned bullish. This hasn't happened in three weeks .
Price is at $4,535, sitting above both EMA200 lines (cyan ~$4,480, red ~$4,460). The 3-step bottom signal that I've been tracking since the start of the crash:
โ
Step 1: Sweep below $4,100 (Mar 23)
โ
Step 2: Bullish MSS confirmed
โ
Step 3: Holding above structure through multiple retests โ now above EMA200
This is the first time all three steps have completed since the crash started.
โ WHY THIS IS DIFFERENT
Previous bounce attempts:
Mar 17: MSS at $5,020 โ rejected at EMA200 ($5,040) โ died in hours
Mar 20: MSS at $4,650 โ rejected at EQH ($4,700) โ died in hours
Mar 24: MSS at $4,400 โ tested EMA200 โ held but didn't break above
Today: Price has been consolidating around EMA200 for 4 days ($4,360-$4,560 range) and is now sitting above it. Not a V-shaped spike that gets instantly rejected โ a gradual reclaim with structure building.
โ KEY LEVELS
Support: $4,480 (EMA200 โ now support, was resistance for 3 weeks)
Support: $4,440-4,460 (EMA200 red + recent BoS zone)
Resistance: $4,560-4,580 (recent highs)
Target: $4,640-4,680 (next structural resistance from Mar 25)
โ WHAT TO WATCH
The critical test now: does EMA200 hold as support on a pullback?
If price pulls back to $4,480 and bounces โ EMA200 role reversal confirmed โ first genuine recovery signal since the crash.
If price falls back below $4,440 โ another failed attempt, back to bearish.
Three weeks of tracking this crash, and this is the most structurally complete bullish setup we've seen. The structure isn't just bullish โ it's bullish above the EMA200 for the first time.
Not financial advice. For educational purposes only.
XAUUSD: Bullish Structure at EMA200 โ The Retest That Matters
This analysis uses SmartFlow SMC (Free) โ auto-detects BoS, MSS, EQH/EQL, BSL/SSL, and Sweeps. No repainting. Community Scripts. Pro version coming soon.
โโโโโโโโโโโโโโโโโโโโโโโโโโโโโโโโโโโโโโโ
โ STRUCTURE
Something has shifted. SmartFlow shows LONG/Bullish for the first time in days, with price at $4,445 โ right at the EMA200 convergence zone.
Price bounced from $4,360 with bullish BoS stacking up. The EMA200 lines (cyan ~$4,480, red ~$4,450) are converging and price is sitting right between them. This is the tightest price-to-EMA200 relationship we've seen since the crash started.
Key difference from previous bounces: price is consolidating at EMA200 instead of getting rejected immediately . Previous attempts ($5,040, $4,700, $4,500) all saw sharp rejections within hours. Today, price is building structure around this level.
โ KEY LEVELS
Resistance: $4,480 (EMA200 cyan โ the breakout level)
Resistance: $4,520-4,560 (recent BoS highs from Mar 25-26)
Support: $4,400 (current structure base)
Support: $4,360 (EQL zone โ bounce origin)
โ WHAT TO WATCH
This is the 3-step bottom test again:
โ
Sweep below $4,360 โ done
โ
Bullish MSS + BoS โ done, structure is bullish
โณ Hold above $4,400 after EMA200 interaction โ in progress
If price closes above $4,480 and pulls back to hold $4,400-4,450 โ first confirmed structural reversal in 2 weeks. If rejected below $4,400 โ same pattern, next leg down.
The fact that structure is bullish while price sits at EMA200 (not $200 below it) is the most constructive setup since the crash began.
Not financial advice. For educational purposes only.
NATGATE - 8 RECORD SESSION LOWS ?NATGATE : CURRENT PRICE : RM1.00 - RM1.02
NATGATE has been in a corrective phase and recently printed an 8-session low, which often signals selling exhaustion and opens the door for a technical rebound. (The record session topic is discussed by STEVE NISON in his book - BEYOND CANDLESTICK , PAGE 121 - 127)
A bullish piercing line appeared in Fridayโs session, where buyers pushed price well into the prior bearish candleโs body. Stochastic oscillator is currently in the oversold zone, signalling a potential technical rebound.
ENTRY PRICE : RM1.00 - RM1.02
FIRST TARGET : RM1.10
SECOND TARGET : RM1.22 (near EMA 200) - The EMA 200 has capped price twice, acting as strong dynamic resistance, look at the green highlighted area.
SUPPORT : RM0.935
Notes : For reference, Iโve attached the link to my previous write-up related to this setup.
FTAI - Second Opportunity as Trend Structure HoldsFTAI - CURRENT PRICE : 285.75
After the prior technical buy call reached both targets, FTAI is now forming another technically constructive setup worth monitoring. For reference, my previous technical buy call, which successfully hit both targets, is attached in link section.
After the breakout on 30 December 2025, price advanced strongly, followed by a pullback that has reached the 38.2% Fibonacci retracement, which is typical and healthy in strong trends. Price continues to hold above the EMA 50, keeping the medium-term uptrend intact.
Momentum indicators remain supportive of renewed upside. RSI is holding above the 50 level, confirming bullish momentum remains intact, while MACD stays above the zero line with an improving histogram, signaling strengthening upside momentum following the consolidation phase. This combination suggests the pullback has allowed momentum to reset without breaking the broader bullish structure.
ENTRY PRICE : 285.75
FIRST TARGET : 320.00
SECOND TARGET 338.00
SUPPORT : 255.61 (the low of 11 February 2026 candle)
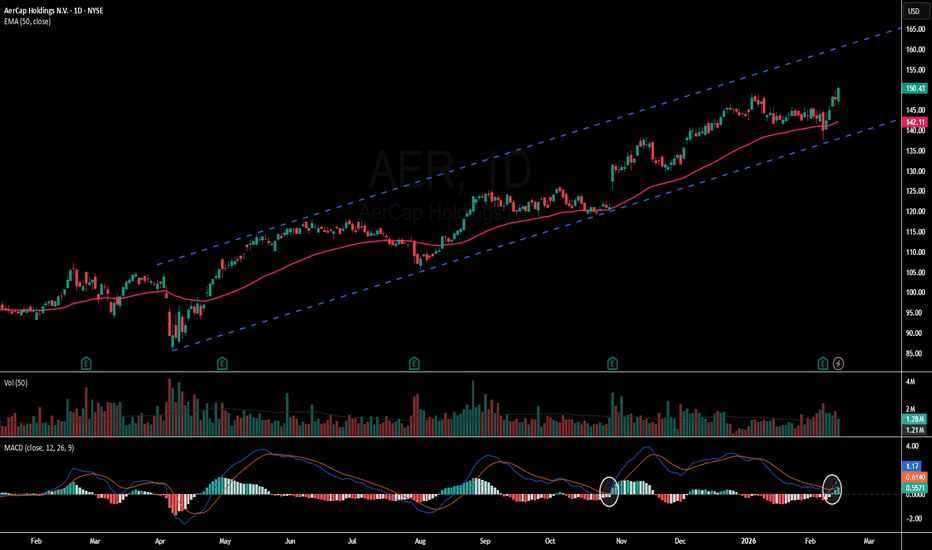
AER - Ascending Channel & MACD Signal Point to Further UpsideAER - CURRENT PRICE : 150.43
AerCap Holdings N.V. (AER) is currently trading at all-time high levels, which reflects strong bullish momentum and continued demand from buyers. When a stock reaches new highs, it enters a price discovery phase with no historical resistance above, often signaling sustained upward strength.
Technically, price is moving within a well-defined ascending channel , forming higher highs and higher lows โ a classic sign of a healthy uptrend. In addition, the stock is trading comfortably above the EMA 50, which is sloping upward, confirming that medium-term momentum remains firmly bullish and that pullbacks are being supported.
Momentum indicators are also turning positive. The MACD is showing a fresh bullish crossover, similar to previous instances highlighted on the chart (look at white circle) where a crossover was followed by a strong price rally. The histogram is turning positive again, suggesting that upside momentum is building at an early stage. If this setup follows the previous pattern, it could lead to another leg higher.
Overall, with price at all-time highs, a strong uptrend channel structure, trading above EMA 50, and an early bullish MACD signal, the technical outlook remains biased toward continued upside.
ENTRY PRICE : 148.00 - 150.43
FIRST TARGET : 163.00
SECOND TARGET : 173.00
SUPPORT : 137.55
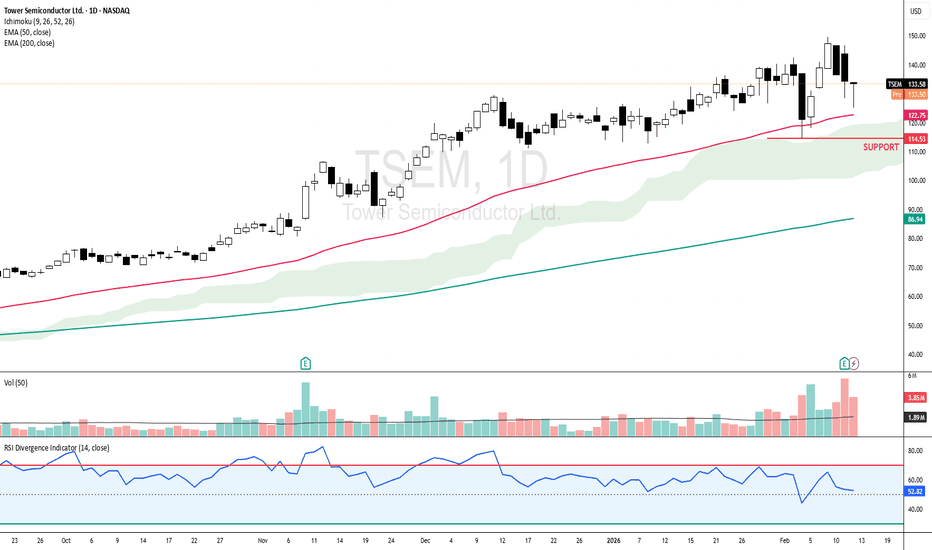
TSEM - Hammer at EMA 50 Confirms Bullish Trend ContinuationTSEM - CURRENT PRICE : 133.58
๐ TSEM โ Technical Buy Call (Hammer at EMA 50)
Tower Semiconductor (TSEM) remains in a strong uptrend, with price holding above EMA 200 (long-term bullish) and above EMA 50 (medium-term bullish). The recent hammer candle near EMA 50 signals strong buying interest and rejection of lower prices. Importantly, price has been staying above the Ichimoku Cloud since May 2025, confirming a sustained bullish trend. RSI remains above 50, supporting positive momentum.
According to data from the Moomoo platform, major Wall Street analysts have upgraded the stock, with price targets revised higher to a range of USD 140โ180.
ENTRY PRICE : 130.00 - 133.58
FIRST TARGET : 154.00
SECOND TARGET : 170.00
SUPPORT : 114.53 (the low of 04 FEB 2026 candle)
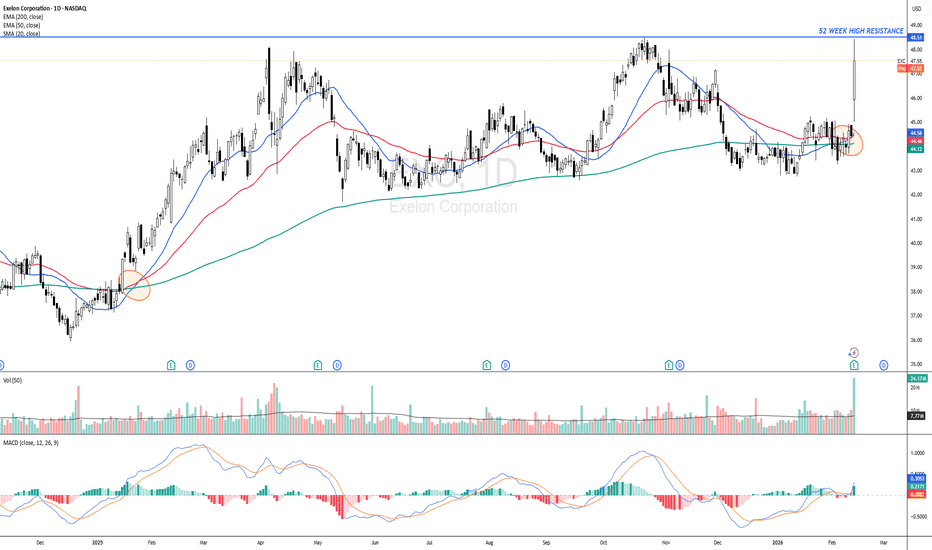
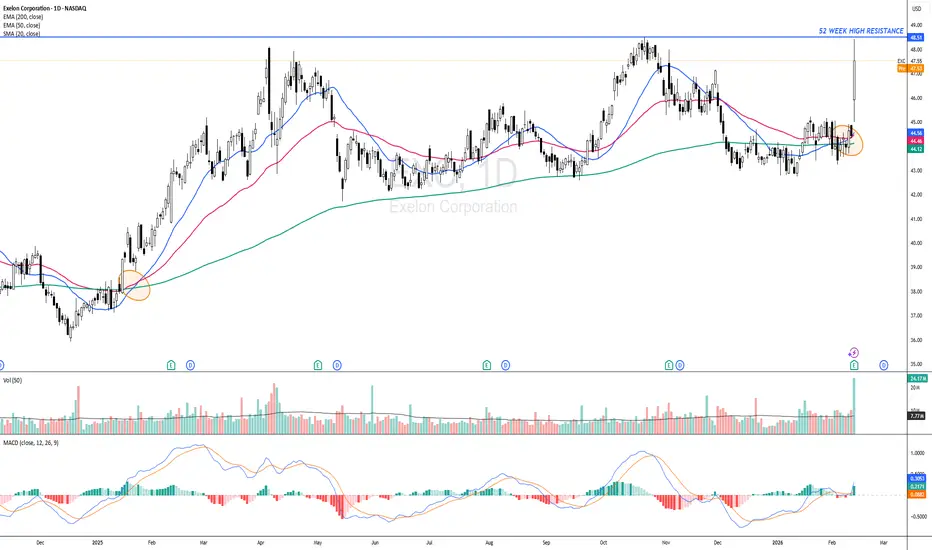
EXC - Positive MA Structure with MACD ConfirmationEXC - CURRENT PRICE : 47.55
Exelon Corp is flashing a bullish moving-average crossover, with SMA 20 crossing above EMA 50 and EMA 200, signalling a positive shift in trend. This setup has occurred before (look at orange circle) and previously led to a strong upside move. Price is holding above key moving averages, maintaining a bullish bias, while MACD remains bullish, confirming improving momentum. Rising volume supports the bullish moving-average crossover, indicating increasing participation from buyers.
ENTRY PRICE : 46.50 - 47.55
FIRST TARGET : 52.00
SECOND TARGET : 57.00
SUPPORT : 42.00
Company profile : Exelon Corp. is a utility services holding company, which engages in the energy distribution and transmission businesses. It operates through the following segments: Commonwealth Edison Company, PECO Energy Company, Baltimore Gas and Electric Company, Potomac Electric Power Company, Delmarva Power and Light Company, and Atlantic City Electric Company. The company was founded on February 4, 1999 and is headquartered in Chicago, IL.
AMAZON - EMA 200: Where Institutions Step InAMZN - CURRENT PRICE : 237.70
๐ AMZN โ Institutional Support Holds, Momentum Breakout
AMZN continues to trade in a primary uptrend, with EMA 200 acting as a strong institutional accumulation zone. Multiple pullbacks toward the EMA 200 (highlighted in green) were met with immediate buying interest, confirming long-term demand.
Momentum is now turning bullish:
๐ฅPrice has broken back above the Ichimoku Cloud, signaling trend resumption.
๐ฅRSI is crossing above the 60 level, a classic sign of bullish momentum acceleration.
This setup favors momentum traders looking to enter as the uptrend resumes.
ENTRY PRICE : 235.00 - 237.80
TARGET : 258.00 (All Time High level)
SUPPORT / INVALIDATION : EMA 200
๐ As long as price holds above EMA 200, the bullish structure remains intact.
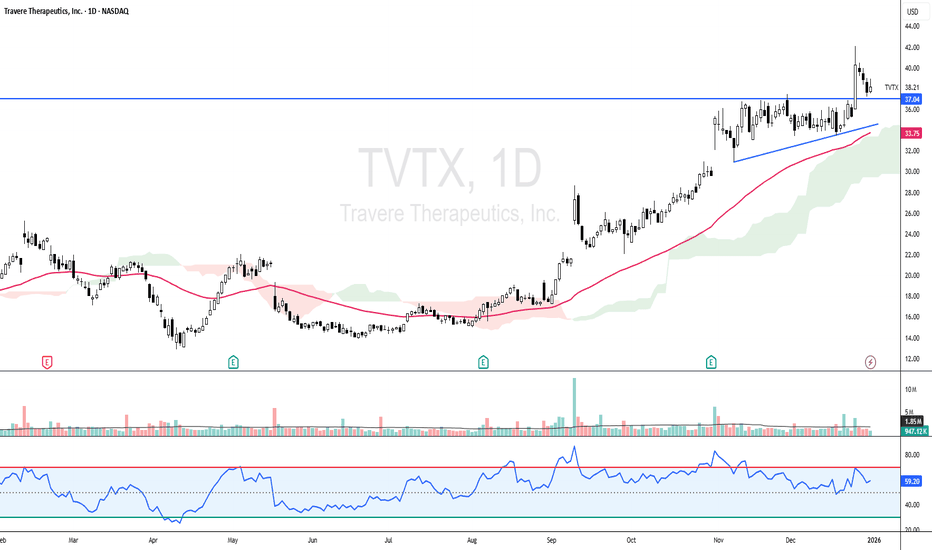
TVTX - Breaks a 10-Year High โ A New Chapter BeginsTVTX - CURRENT PRICE : 38.21
TVTX has made a major technical breakout by moving above its 10-year high at $37.04, a level last seen in August 2015. This move places the stock firmly into price discovery, meaning there is no nearby historical resistance overhead. Importantly, the breakout is holding, with the previous resistance now acting as strong support, a key sign of a healthy and sustainable uptrend.
Looking back, the 24 December breakout can be viewed as an ascending triangle breakout, where price consistently made higher lows before finally pushing above resistance. This pattern often signals strong accumulation and continuation rather than a short-term spike. Trend indicators remain supportive, with price trading above the EMA 50 and above the Ichimoku Cloud, both pointing to a well-established bullish trend.
From a price action perspective, the latest candlestick structure has formed a Bullish Harami based on Japanese candlestick analysis , suggesting selling pressure is fading and buyers may be preparing for the next move higher. As long as TVTX continues to hold above the former resistance zone and the EMA 50 on a daily closing basis, pullbacks are considered buy-on-dip opportunities. The next upside targets are $42 followed by $45, while a daily close below the EMA 50 would invalidate the bullish setup and serves as a cut-loss level.
ENTRY PRICE : 38.21
FIRST TARGET : 42.00
SECOND TARGET : 45.00
SUPPORT : EMA 50 (Cutloss if price closed below EMA 50)
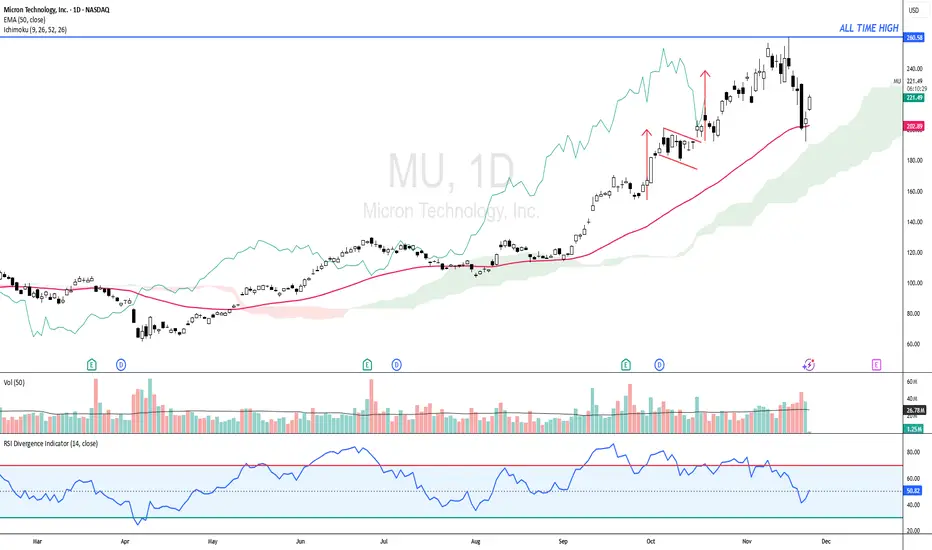
MU โ Trend Still Intact, EMA50 Bounce SetupMU - CURRENT PRICE : 220.00 - 222.00
Technical Reasons (Bullish Bias)
1๏ธโฃ Price retesting strong dynamic support
Price is holding above the 50-day EMA, which has acted as support throughout the uptrend. Pullback into EMA50 often forms a bullish continuation point.
2๏ธโฃ Price still above the Ichimoku Cloud
Price is trading above the cloud, meaning long-term trend remains bullish. The cloud is thick โ showing strong trend support. Latest pullback is testing the top of the cloud, usually a high-probability bounce area.
3๏ธโฃ RSI turning up from mid-zone (not overbought)
RSI is around 50, which is a healthy reset in an uptrend. No overbought conditions โ room for upside continuation.
4๏ธโฃ Trend structure remains bullish
Higher highs & higher lows remain intact. Current candle shows buying interest at key support.
5๏ธโฃ Market respects previous breakout area
Price pulled back to retest SeptemberโOctober breakout zone โ classic break-and-retest setup.
ENTRY PRICE : 218.00 - 222.00
FIRST TARGET : 236.00
SECOND TARGET 260.00
SUPPORT : 201.00
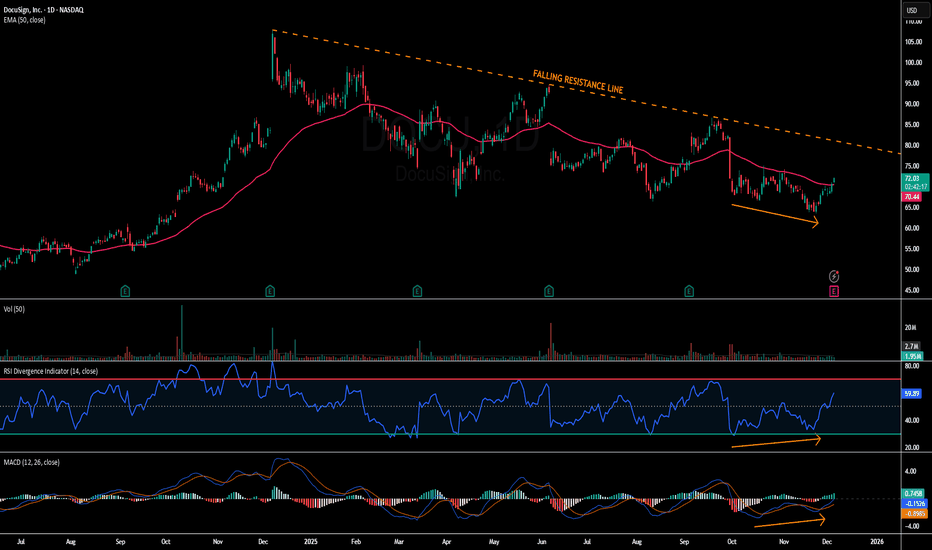
DOCU - Trendline Resistance in FocusDOCU - CURRENT PRICE : 71.87
Short-term outlook for DOCU is bullish as price moves above the EMA50, supported by RSI holding above 50 and bullish divergence in both RSI and MACD (look at orange arrows). Momentum continues to improve with a MACD bullish crossover, positioning DOCU for a move toward the long-term downtrend line. First target is $79 near trendline resistance, with a potential extension to $85, while $65 remains the key support and invalidation level.
ENTRY PRICE : 70.00 - 71.87
FIRST TARGET : 79.00
SECOND TARGET : 85.00
SUPPORT : 65.00
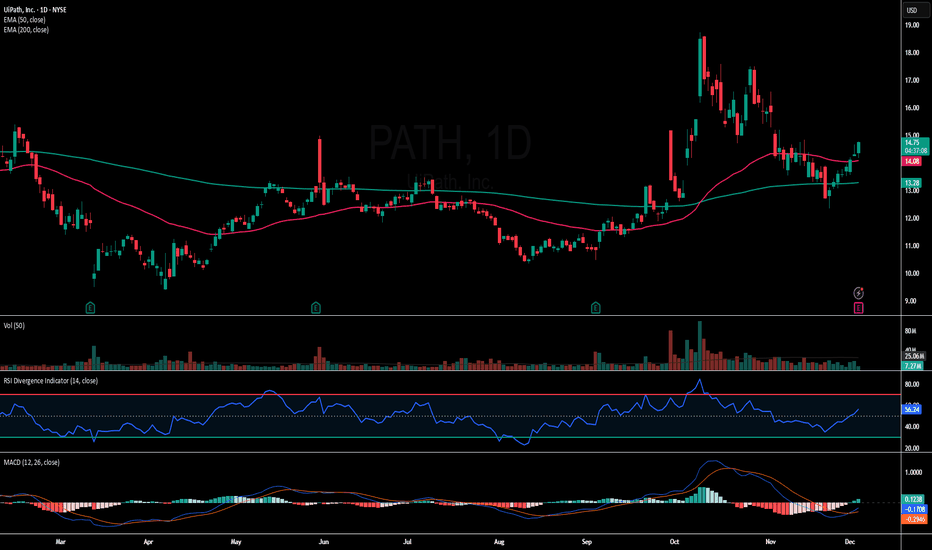
PATH - Price Reclaims 50-EMA and 200-EMAPATH - CURRENT PRICE : 14.50 - 14.70
PATH is gaining traction after reclaiming both the 50-EMA and 200-EMA, signalling a shift back into short-term bullish momentum ๐. Price strength is supported by rising RSI and an improving MACD cross, suggesting buyers are regaining control.
๐ฅ Bullish Points
Price reclaimed 50-EMA and 200-EMA
RSI trending above 50 โ bullish momentum returning
MACD turning positive with increasing histogram
Volume uptick on recent green candles = buyers active
ENTRY PRICE : 14.50 - 14.70
FIRST TARGET : 16.00
SECOND TARGET : 17.30
SUPPORT : 13.00
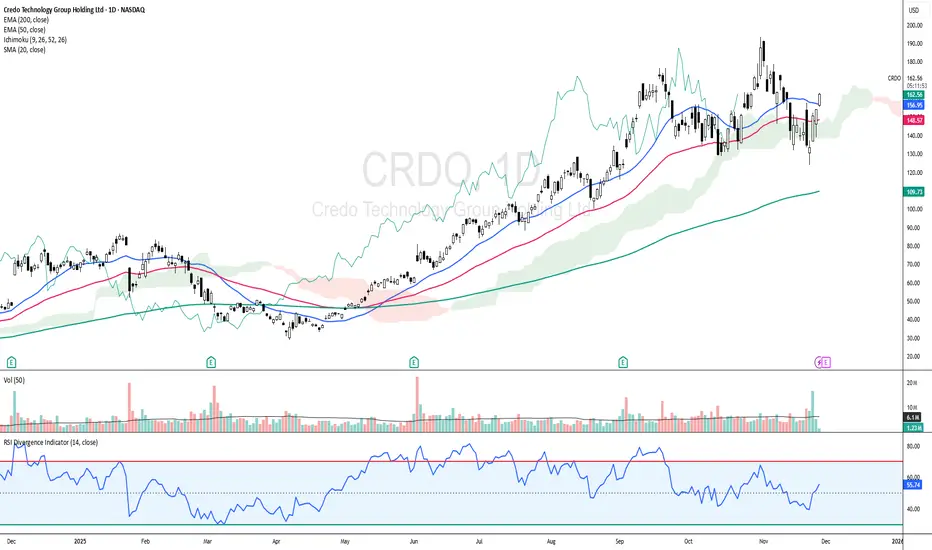
CRDO: Cloud + EMAs Aligning for Upside ContinuationCRDO - CURRENT PRICE : 162.95
CRDO is showing a bullish reversal setup as price rebounds and closes back above the EMA50 while holding firmly above the Ichimoku Cloud , signaling the major trend remains intact. Momentum is improving with RSI rising above 50 and not yet overbought, supported by increasing volume on the recent bullish white candlestick.
Todayโs move above the 20-day SMA adds a positive layer to the short-term trend structure. Short term targets are 175.00 and 185.00 while support is 148.00.
ENTRY PRICE : 160.00 - 162.95
FIRST TARGET : 175.00
SECOND TARGET : 1.85
SUPPORT : 148.00
btc finds 200 ema support, whats next?As I have been posting in these "Ideas" for the past few weeks about market direction and where the price for BTC will go. It now has come to pass where the 200 EMA has been tested and support has been found, It however has not generated any relief among buyer sentiment unable to push price above the previous days close leaving the digital asset to continue to bleed out and cause positions from all the 93k Bulls to liquidate.
Its a shame people cannot make the connection that the only way price can go higher is to go lower in a market. That Is why I am going to warn people about where we may go , I believe the 200 EMA will be tested again and if support is broken it will send is into the low 70k area where there are open orders and It is possible this may happen. The Bull market support band is the 200EMA however there may be institutional money that may drive us down to cause massive liquidations and fear and panic among those holding bags while greed causes big players to push more into the fringe of where we can maintain a recovery.
Watch for a retest of the 200EMA . which is a bit of a fuzzy zone , use the high and low to denote the area for support as well as keep an eye on the RSI and CCI , we are also watching on balance volume drop off which is not a great sign that there is market confidence however this will play out over the weekly and the weekly candle will start to materialize in the next few days.
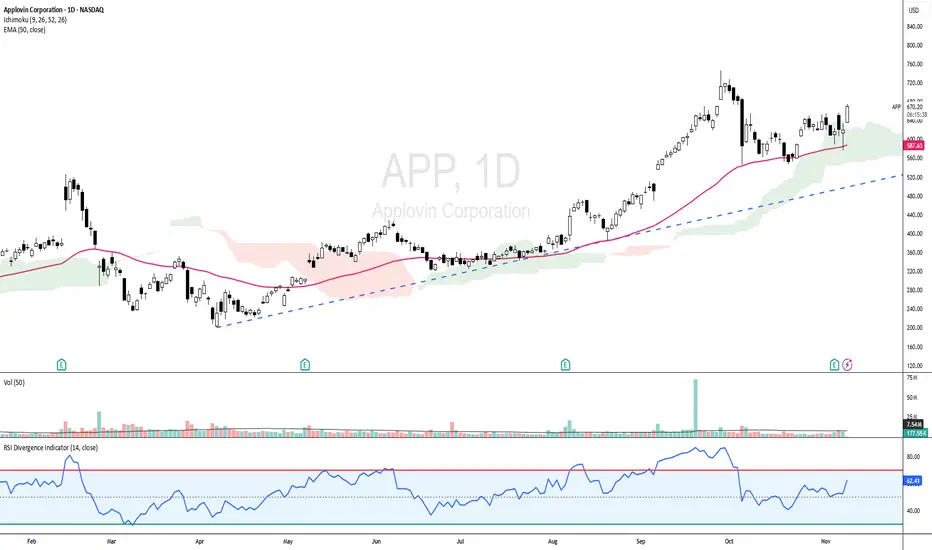
APP - UPTREND STILL INTACT!APP - CURRENT PRICE : 670.00 - 674.00
APP is showing strong bullish momentum as the price trades above the 50-day EMA and ICHIMOKU CLOUD , indicating a sustained uptrend. The RSI is in bullish territory but not yet overbought, indicating room for further upside. With the current setup, the stock has potential to retest its all-time high area if momentum continues.
ENTRY PRICE : 670.00 - 674.00
FIRST TARGET : 727.00
SECOND TARGET : 770.00
SUPPORT : 50-day EMA
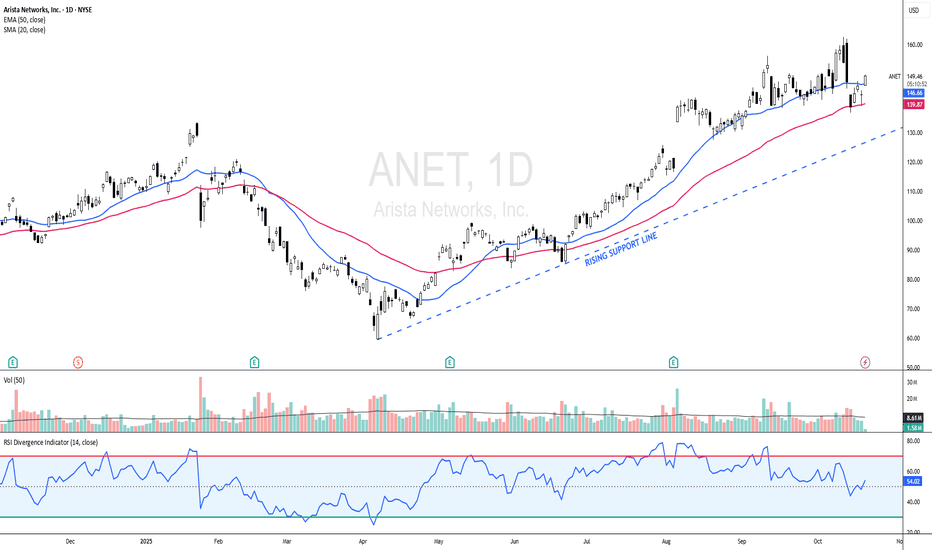
ANET - Rebounds from EMA 50ANET - CURRENT PRICE : 148.00 - 149.00
Technical Rationale:
1. Rebound from Key Moving Average Support
The stock price has rebounded strongly from the 50-day EMA, which has acted as a dynamic support level throughout the uptrend. This rebound indicates renewed buying interest at a technically significant area.
2. Bullish Momentum Confirmation
ANET has crossed above the 20-day SMA, suggesting a short-term shift back to bullish momentum after a healthy pullback. This crossover reflects improving short-term trend strength.
3. Rising Support Line Intact
The long-term rising support trendline remains intact, confirming that the broader uptrend structure is well-maintained. Each corrective phase has so far been supported near this line, reinforcing the bullish bias.
4. Momentum Indicator (RSI)
The RSI is recovering from the mid-zone (~53), showing that bullish momentum is building again without being overbought. This supports the potential for further upside continuation.
ENTRY PRICE : 148.00 - 149.00
FIRST TARGET : 162.00
SECOND TARGET : 173.00
SUPPORT : 136.00
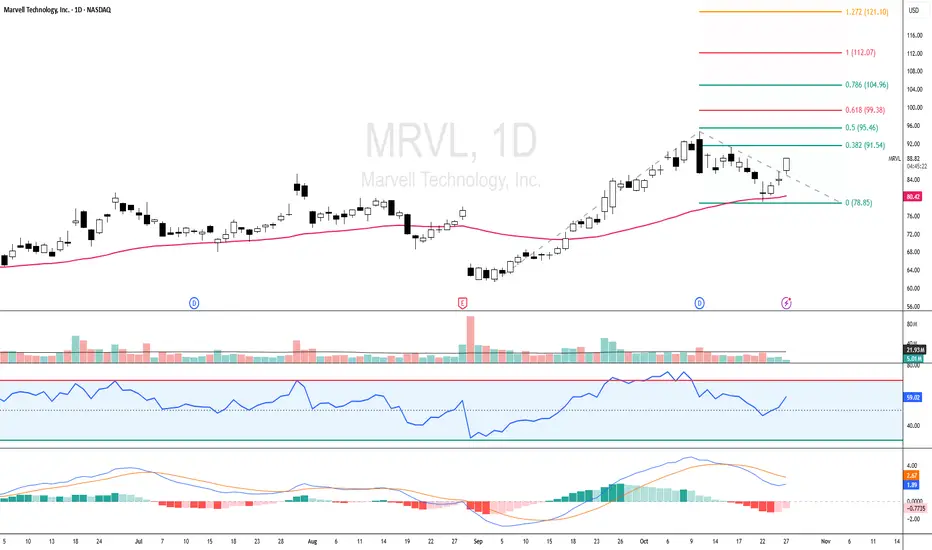
MRVL - RSI Back Above 50, Eyes Fibonacci Targets at 99 and 112MRVL - CURRENT PRICE : 86.00 - 88.00
MRVL is showing early signs of bullish continuation after finding support near the 50-day EMA and rebounding with positive momentum. The price structure remains healthy as it trades above the EMA 50, suggesting the medium-term trend is still intact.
Key Technical Highlights :
1) Price Above EMA 50
The stock price is holding above the EMA 50, showing that the uptrend remains valid and buyers are still in control.
2) RSI Above 50 and Not Overbought
RSI has crossed back above the 50 level, confirming improving momentum while staying below overbought territory, leaving more room for upside.
3) MACD Structure
Although the MACD line is still below the signal line, both are positioned above the zero level, indicating the overall market tone remains positive with potential for a new bullish crossover.
Based on Fibonacci extension, potential upside targets are at :
1st Target: USD 99.00 (0.618 level)
2nd Target: USD 112.00 (1.000 level)
ENTRY PRICE : 86.00 - 89.00
FIRST TARGET : 99.00
SECOND TARGET : 112.00
SUPPORT : 80.50
DRIFT Breakout Setup โ Higher High + Retest in PlayDRIFT is showing strong bullish momentum after months of accumulation. The token has broken out, printed a higher high, and is now retesting the previous range high as support โ a classic setup for continuation.
With price hovering near the 21-day EMA, this zone could act as a launchpad if sentiment holds. The structure supports a potential leg higher, making this a high-reward, low-risk opportunity for swing traders.
๐น Trade Setup
Entry Zone: $0.68 โ $0.72
Take Profit Targets:
๐ฅ $1.02
๐ฅ $1.27
๐ฅ $1.50
Stop Loss: Daily candle close below $0.60
๐ Keep an eye on volume confirmation and overall market sentiment. A clean bounce from this support zone could validate the setup.
๐ Like, comment, or share your thoughts below!
๐ Follow for more crypto setups and technical insights.
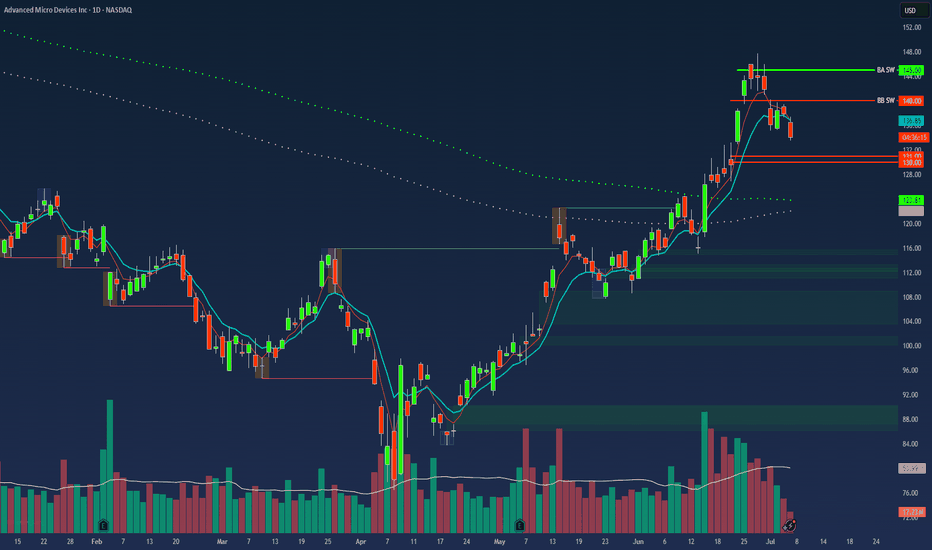
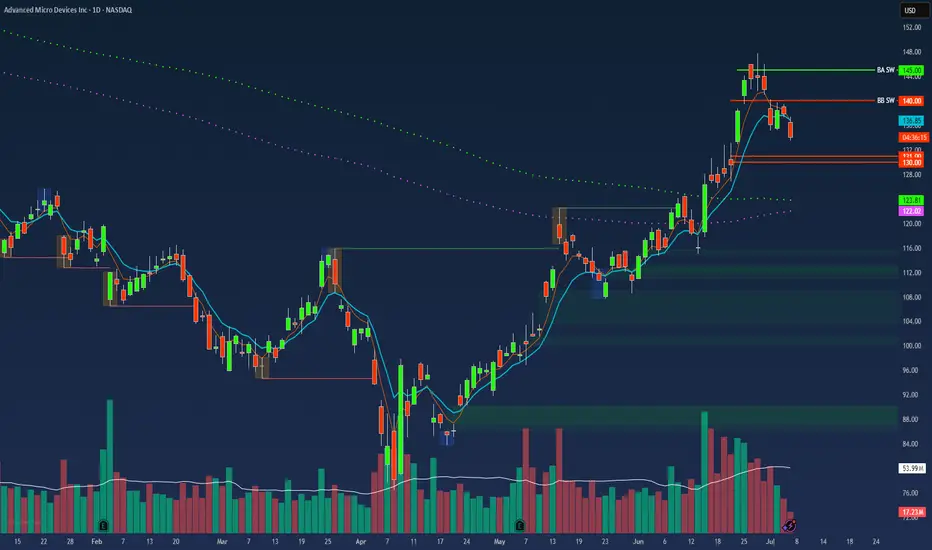
$AMD Swing Trade โ Put Debit Spread Setup๐ป NASDAQ:AMD Swing Trade โ Put Debit Spread Setup (Jul 18 Exp)
๐
Trade Opened: July 3, 2025
๐ Strategy: Buy to Open (BTO) Put Debit Spread
๐ Strikes: $31 / $30 (Jul 18 Expiration)
๐ต Cost (Premium Paid): $0.21
๐ฏ Trade Thesis
This setup aims to capture short-term downside in NASDAQ:AMD via a low-cost, defined-risk spread. The trade fits within my broader portfolio of OTM spreads under $0.25.
Key Drivers:
๐ป Semi sector under pressure โ NASDAQ:AMD showing relative weakness.
๐ Breakdown below key support near $31 and rejection at VWAP.
๐งพ Weak momentum โ MACD trending down, RSI near 44.
๐ Trade enters into earnings season volatility.
๐ Technical Setup (Daily)
EMA(4) < EMA(8) < EMA(15): Bearish structure fully intact.
VWAP: Price rejected from 30-day VWAP zone.
MACD/RSI: Momentum still fading, no signs of bullish divergence.
โณ Strategy Notes
Max loss: $0.21
Max gain: $0.79
Risk/reward structured for a drop into or below $30
Expiration: July 18
๐ง Journal Note
Most of my trades are swing-based using OTM debit spreads with tight risk control. No same-day entries โ setups must have defined technical compression and short-term catalysts.
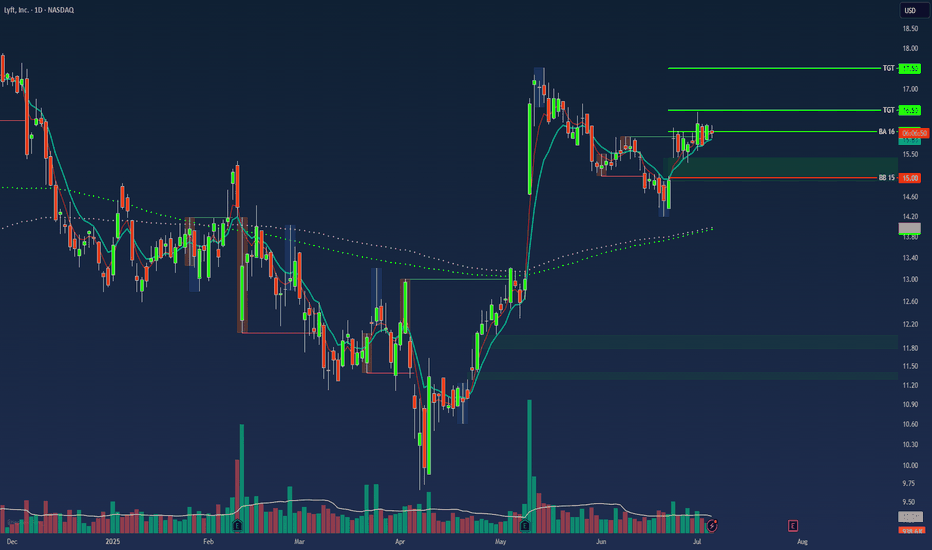
$LYFT Swing Trade โ Low-Cost Call Debit Spread Setup๐ NASDAQ:LYFT Swing Trade โ Low-Cost Call Debit Spread Setup (Jul 18 Exp)
๐
Trade Opened: July 3, 2025, 2:53 PM
๐ Strategy: Buy to Open (BTO) Call Debit Spread
๐ Strikes: $16.5 / $17.5 (Jul 18 Expiration)
๐ต Cost (Premium Paid): $0.25
๐ฏ Trade Thesis
This swing trade targets a short-term bullish move in NASDAQ:LYFT based on improving fundamentals and favorable technical setup. The structure uses a low-cost OTM call spread to define risk and limit exposure while capturing directional potential.
Catalysts supporting the move:
๐ Autonomous vehicle rollout beginning this summer (Atlanta) and expanding to Dallas (2026) via Mobileye partnership.
๐ณ Activist investor Engine Capital pushing for governance changes and strategic alternatives.
๐ต Gross bookings at record levels, with net income and free cash flow turning positive.
๐ Analyst upgrade from TD Cowen with a $21 target (+30% upside from entry).
๐ Technical Setup (Daily Chart)
๐ EMA(4) < EMA(8) < EMA(15): Bearish alignment beginning to flatten โ potential compression signal.
โ VWAP (30โday): Price consolidating near long-term VWAP โ watching for reclaim.
๐ MACD: Bullish crossover emerging.
๐ RSI: ~36 โ approaching oversold territory, setting up possible reversal.
โณ Strategy Notes
Position type: OTM vertical call debit spread.
Risk defined: Max loss = $0.25 per contract.
Max gain: $0.75 if LYFT closes at or above $17.5 by expiration.
Timeframe: 2-week swing through July 18, ahead of Q2 earnings (~Aug 6).
๐ง Journal Note
This position aligns with a broader strategy focused on OTM spreads priced under $0.25, using technical compressions and fundamental tailwinds. Trade was opened not on an entry signal day - this avoids front-running momentum shifts.