XAUUSD Algo Map: Bearish Expansion & Decision Core Breakdown💎 XAUUSD Algo Map: Bearish Expansion & Decision Core Breakdown
📋 Report ID: XAUUSD-DAILY-2026-07-24
Asset: Gold Spot (XAU/USD)
Timeframe: Daily (Macro) / 15m (Intraday)
📊 Data Anchor: July 24, 2026 (Daily Close: July 23, 2026)
🔭 Market Context & Price Action
The daily structure for Gold (XAUUSD) has shifted into a dominant bearish expansion phase (Bearish Engulfing Body). Following a brief opening push to a high of 4141.275, institutional supply aggressively flooded the market, driving a massive drop of over $100. The asset sliced through central equilibrium metrics and closed near its low at 4049.780. Closing deeply beneath the primary decision core decisively confirms the loss of buyer control and establishes a strong bearish bias heading into the weekly close.
🎯 Key Structural Price Zones
The following zones map the absolute structural boundaries and immediate battlegrounds:
🔴 Absolute Structural Ceiling: 4215.065
This mathematically derived boundary represents the absolute maximum upward ceiling (Final Ceiling) for the macro cycle. Intermediate upper extensions reside at 4178.170 and 4171.345.
🔴 Primary Resistance & Flip Zone (Decision Core): 4077.080 - 4090.730
The critical structural fault line. This dense band combines the central computational core (4077.080), the primary algorithmic layer (4087.720), and the 50% equilibrium threshold (4090.730). Having collapsed below this zone, this former support block has transitioned into a major overhead supply barrier (Flip Zone). Higher intermediate resistance extensions sit at 4095.528 and 4105.380.
🔵 Immediate Support Base: 4031.247 - 4040.513
The primary physical floor. This zone, anchored by the session low of 4040.185 and supported by lower algorithmic boundaries at 4031.247, temporarily halted the selling cascade late in the session.
🔵 Deep Strategic Demand Zone (Discount Target): 3994.180 - 4014.606
The primary target cluster for sellers. This dense demand block incorporates lower computational boundaries spanning from 4014.606 down through 4012.885, 3999.235, and the extreme floor boundary of 3994.180.
⚫ Absolute Structural Floor: 3911.795
The ultimate underlying macro safety net (Final Floor). Extended downward targets ahead of this floor lie at 3975.990 and 3969.165.
⚖️ Order Flow & Trade Scenarios
Bearish order flow is currently dictating price action, favoring "Sell on Rally" setups:
🔴 Bearish Scenario (Primary - Sell on Rally): As long as the price remains capped beneath the 4077.080 - 4090.730 decision core, the dominant strategy is selling into corrective rallies. Any pullback into the 4067.856 - 4077.080 pivot region offers a high-probability entry for a retest of the 4040.185 physical low. A confirmed breakdown beneath 4031.247 will accelerate the expansion toward the 4014.606 and 3994.180 deep demand block.
🟢 Bullish Scenario (Structural Invalidation): To neutralize the current bearish momentum, buyers must drive price action back above the decision core, securing a confirmed daily close above 4090.730. This would invalidate the bearish setup and reopen the path toward upper supply at 4113.975 and 4139.554.
──────────────
Trade Safe and follow the structure.
◈ Quantix Labs  Long
Long
Canadian Dollar Stuck Between Tariffs and OilUSD/CAD traded with a firmer tone on Tuesday as the Canadian Dollar remained under pressure from the latest U.S. tariff escalation. The U.S. imposed a 50% tariff on a range of Canadian goods tied to disputes over cars, alcohol, and dairy, which immediately complicates Canada’s trade outlook. Normally, elevated oil prices would give the Canadian Dollar a cleaner tailwind, but tariff risk and weaker domestic momentum are making that support less powerful.
For the BOC, the rate path remains a hold story. The central bank kept rates at 2.25% last week and continues to balance elevated inflation against soft growth and trade uncertainty. Canadian inflation already surprised to the downside this week and is expected to ease if oil and gasoline pressures fade, but that forecast now sits against a more complicated trade backdrop. The Canadian Dollar is stuck between two forces: oil supporting Canada’s terms of trade and tariff risk undermining confidence in the growth outlook.
In the above chart, USD/CAD has found follow through in recent weeks after finally breaking out of a multiyear triangle that originated in 2023. In June it was noted that “the first hurdle to validate the bullish breakout is the band of resistance formed by the highs in January, March, and April of this year around 1.3929/66. Through these levels, USD/CAD may have offered the strongest confirmation yet that the near three-year triangle has ceded way to a new bullish trading regime.” Along these lines, USD/CAD’s recent turn higher through its 50-day EMA (exponential moving average) ahead of 1.3929/66 suggests that a series of higher highs and higher lows is emerging. The low carved out by the bullish engulfing bar on July 20 just above 1.4000 may be respected as a turning point in the near-term. That said, a resolution of the fundamental disputes, particularly on tariffs, could override this technical turning point and shift the near-term focus back to the downside. Nifty Analysis EOD – July 13, 2026 – Monday🟢 Nifty Analysis EOD – July 13, 2026 – Monday 🔴
Bear Trap: Bulls Recover and Test the 24,250 Fortress
🗞 Nifty Summary
Nifty gapped down 185 points on geopolitical tension, opening right at the 24,040 support. The first tick found its base at the exact 24,000 level, and from there the index gave a steady recovery of 158 points within the first hour.
After reaching 24,150, Nifty got trapped inside a narrow range of about 35 points between the PDL and 24,150 for almost an hour and 45 minutes. Around 12 PM, it finally exited this range and broke the CPR, PDC, PDH, and R1, pushing up to test 24,250 — which is almost the previous month’s high too.
By the end, the day closed at 24,208.60 on an intraday basis, 51 points below the day’s high. Adjusted closing came in at 24,211.
Today’s close is exactly at the previous session’s intraday close. Today’s range extended on both sides of the previous session, forming a daily engulfing candlestick pattern, which may point to highly volatile sessions in the coming days. The day opened at the previous day’s low and broke the previous day’s high, but couldn’t close above the PDH — so we can still categorise it as a kind of bear trap session too.
For tomorrow, the opening is the most important factor for the directional view. We are sitting very close to the 24,250 resistance. If Nifty gaps up above this level and holds it, then we can expect the bullish sentiment to continue. But if it opens inside the range, then we have to wait for a directional view, because there is a clear sign of selling pressure at this level. Tomorrow also has a weekly expiry, and call writers don’t let go easily — so be ready for a strong fight and some volatility.
🛡 5 Min Intraday Chart with Levels
📉 Daily Time Frame Chart with Intraday Levels
🕯 Daily Candle Breakdown
Open: 24,039.40
High: 24,259.80
Low: 24,000.20
Close: 24,211.00
Change: +4.10 (+0.02%)
🏗️ Structure Breakdown
Type: Bullish candle with a long lower wick — buyers took control after an early scare
Range: ≈ 260 points — high volatility
Body: ≈ 172 points — steady buying pressure once the base held
Upper Wick: ≈ 49 points — some rejection near the highs, sellers active around 24,250
Lower Wick: ≈ 39 points — demand showed up quickly at the 24,000 base
🛡 5 Min Intraday Chart
⚔️ Gladiator Strategy Update
ATR: 261.82
IB Range: 128.60 → Medium
Market Structure: ImBalanced
Trade Highlights:
09:32 Long Trade: Trailing Target Hit (R:R 1:3.28)
10:53 Short Trade: SL Hit
11:39 Short Trade: SL Hit
13:00 Short Trade: Trailing SL Hit
Trade Summary: The early long worked out well — trailing into a 1:3.28 was the trade of the day. The two shorts after that both hit SL, which in hindsight makes sense; I was fighting a market that had already decided to recover. The 1 PM short at least trailed out instead of a full stop. A reminder for me that shorting into a steady recovery rarely pays, and patience for the right side would have kept things cleaner.
🧱 Support & Resistance Levels
Resistance Zones: 24250 | 24300 | 24360~24380 | 24460
Support Zones: 24160 | 24080 ~ 24030 | 23900 | 23785
🧠 Final Thoughts
“The day was won at the base and paused at the wall — both edges left something unsaid.”
The one thing that stood out today was how quickly demand showed up at the 24,000 level. The gap down looked scary on the open, but the base held on the very first tick and never really got tested again — that early recovery told most of the story.
For tomorrow, everything hinges on 24,250. If we gap above it and hold, the bullish push could keep going toward 24,300 and beyond. But if we open back inside the range, that rejection near the highs today is a sign to stay patient — the selling pressure there is real, and the engulfing candle suggests both sides still have something to prove.
My focus tomorrow is simple: respect the open, and don’t force a direction the market hasn’t confirmed yet. With weekly expiry in play, it’s better to wait for the level to resolve than to guess ahead of it.
✏️ Disclaimer
This is my personal digital diary and represents my own analysis and point of view. It is not financial advice; please consult a professional advisor before making any trading decisions. NZD/USD Falls as RBNZ Hike Path Gets MessyNZD/USD fell as much as half of one percent to start the week as the U.S. Dollar regained ground coming out of the holiday weekend. U.S. yields were mixed, but the broader dollar tone improved as markets wait for Wednesday’s Federal Reserve minutes and reassessed how much room the Fed really can ease – or worse yet, have to tighten – while inflation remains sticky. That left the New Zealand Dollar exposed, especially after a rough stretch where global growth concerns, softer commodity sentiment, and fading risk appetite have weighed on higher-beta currencies.
In New Zealand, the focus is squarely on the RBNZ’s July 8 policy decision. The Official Cash Rate (OCR) sits at 2.25%, but the debate has shifted from easing risk to whether the central bank needs to gradually remove accommodation as inflation stays above target. The limiting factor for delivering a rate hike is growth. The IMF recently warned that New Zealand’s recovery has been delayed by the oil shock and global uncertainty, with inflation expected to stay above the RBNZ’s target band through year-end. That leaves the RBNZ with an ugly, almost stagflation-like mix: inflation too high to turn dovish, growth too soft to sound aggressive.
In the above chart, NZD/USD is struggling to establish a bottom after hitting fresh yearly lows within the past two weeks. The rebound has seen a bearish evening star candlestick pattern emerge against the 1-month moving average, suggesting that recent gains haven’t been significant enough to confidently call a durable low. Similarly, a close below 0.5681 would mean failure to retake the April swing low and would offer greater confidence that a return to the yearly low at .5627 could be revisited soon. GBPUSD with Engulfing by INTELA strategyEngulfing Pro by INTELA + RVOL Context
Overview
Engulfing Pro by INTELA is a price action strategy designed to identify high-probability Engulfing patterns and filter them using Relative Volume (RVOL) analysis. The goal is not simply to trade every engulfing candle, but to distinguish between low-quality signals and those backed by meaningful market participation.
The strategy combines three key concepts:
Engulfing Price Action
Market Structure & Location
Relative Volume Confirmation (RVOL)
By incorporating volume context, traders can avoid many of the false signals commonly associated with traditional engulfing setups.
Core Idea
Not all engulfing candles are created equal.
An engulfing pattern occurring in the middle of a range, with average or declining volume, often lacks conviction and tends to produce inconsistent results.
Conversely, when an engulfing candle appears:
✅ At a significant swing point
✅ Near a support or resistance zone
✅ After a pullback or retest
✅ Accompanied by above-average relative volume
the probability of a meaningful move increases significantly.
The strategy seeks to identify these high-quality situations.
Relative Volume (RVOL) Filter
One of the most important components is the RVOL analysis.
Instead of comparing current volume against a simple moving average of recent candles, the indicator compares volume against the average volume of the same time period from previous trading sessions.
This provides a more realistic assessment of market participation by accounting for intraday volume cycles.
Example
A volume spike occurring at 09:00 should not be compared to volume recorded during a low-liquidity period such as lunchtime.
Instead, it is compared to the historical average volume of previous 09:00 candles.
This creates a more accurate measure of whether institutional or large-player activity is entering the market.
Signal Classification
✅ High-Quality Signals
Characteristics:
Strong engulfing candle
Occurs at market extremes, swing highs or swing lows
Supports the prevailing market narrative
RVOL above normal levels
Clear profit objective nearby
Examples:
Reversal after a liquidity sweep.
Pullback continuation during a strong trend.
Retest of a breakout level.
❌ Low-Quality Signals
Characteristics:
Engulfing pattern inside consolidation.
Signal appears directly into resistance or support.
Low or average RVOL.
Poor risk-to-reward profile.
Appears after an extended move without structure.
These setups are often ignored, even when the engulfing pattern itself is technically valid.
Entry Logic
The strategy is designed around limit-order execution rather than chasing momentum.
Bullish Setup
Bullish engulfing candle forms.
RVOL confirms participation.
Buy limit order placed at 80% retracement of the engulfing candle.
Stop-loss placed at the opening price of the engulfing candle.
Pending order expires after a predefined number of candles if not triggered.
Bearish Setup
Bearish engulfing candle forms.
RVOL confirms participation.
Sell limit order placed at 80% retracement of the engulfing candle.
Stop-loss placed at the opening price of the engulfing candle.
Pending order expires if price fails to retrace within the allowed time window.
What This Strategy Tries to Achieve
The objective is not to generate a large number of trades, but to focus on quality opportunities where:
Price action shows intent.
Volume confirms participation.
Market structure provides context.
Risk remains clearly defined.
This creates a more selective trading approach that prioritizes location and conviction over signal frequency.
Disclaimer
This tool is intended for educational and analytical purposes only. No indicator or strategy can predict market movements with certainty. Always perform your own analysis and apply proper risk management before trading live capital.
"The engulfing pattern provides the signal. RVOL provides the conviction. Market structure provides the context." – INTELA Engulfing Pro by INTELA with RVOL and Support/Resistance Context📈 Backtest: Engulfing Pro by INTELA with RVOL and Support/Resistance Context
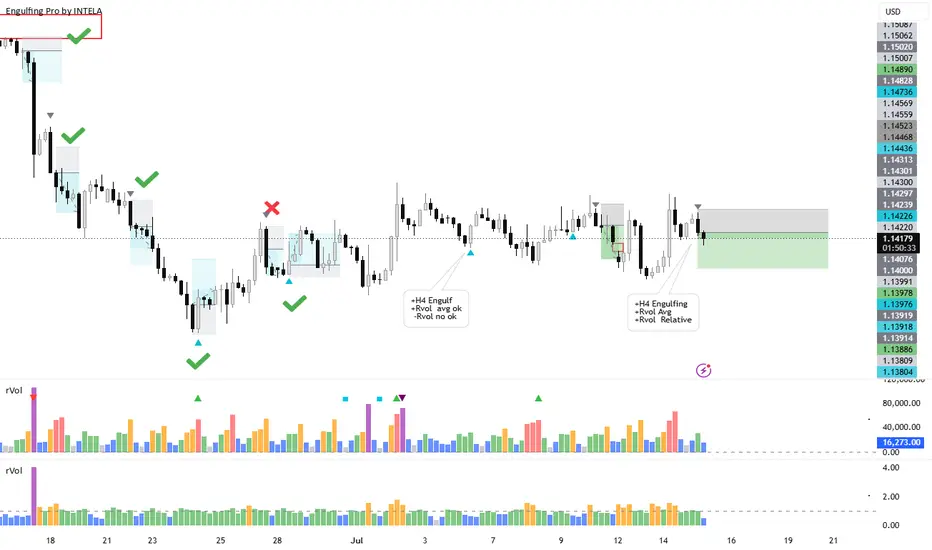
This chart illustrates a series of backtested trades taken using the Engulfing Pro by INTELA indicator. The strategy is not based solely on the engulfing pattern itself, but rather on combining the signal with broader market context to improve accuracy and reduce false entries.
🔑 Core Idea
The Engulfing Pro indicator highlights bullish and bearish engulfing candlestick patterns, which are widely recognized as potential reversal signals. However, in this backtest, entries were filtered and validated using two additional layers of analysis:
Relative Volume (RVOL):
Signals were considered only when accompanied by significant volume activity. RVOL helps confirm whether the engulfing pattern is supported by strong market participation, increasing the reliability of the setup.
Support and Resistance Zones:
Engulfing signals were cross-checked against key supply and demand areas. Trades were taken only when the pattern aligned with these zones, ensuring that entries occurred at meaningful levels where reversals are more likely.
📊 How It Works
Bullish Engulfing: Entry signals are validated when they occur near support zones and are confirmed by elevated RVOL.
Bearish Engulfing: Entry signals are validated when they occur near resistance zones and are confirmed by elevated RVOL.
Trade Management: The combination of candlestick structure, volume confirmation, and contextual zones provides a structured framework for identifying high-probability reversals.
🧠 Professional Takeaway
This backtest demonstrates that while engulfing patterns are powerful, their effectiveness increases significantly when combined with volume analysis and market structure. The Engulfing Pro by INTELA indicator provides the raw signals, while RVOL and support/resistance context refine them into actionable trades. M&M Bullish Engulfing Candlestick PatternMahindra & Mahindra Swing Setup: Bullish Reversal Pattern Challenges Negative Production Narrative
________________________________________
Mahindra & Mahindra Ltd. (NSE: M&M)
Technical Research Report | Daily Timeframe
Current Price: ₹3,001.00 (+1.64%)
Volume: 3.18 Million Shares
Pattern: Bullish Engulfing
Pattern Reliability: 79.0%
Trend Status: Weakening Downtrend
Setup Classification: Multi-Day Swing Setup
________________________________________
1. Fundamental Disconnect vs. Structural Shift
Mahindra & Mahindra currently presents an interesting divergence between short-term fundamental sentiment and emerging technical behaviour.
Recent reports indicating a 15% decline in June SUV production due to supply-chain labour shortages have naturally introduced near-term concerns regarding operational efficiency and production throughput. From a fundamental perspective, such developments often create uncertainty regarding delivery schedules, inventory planning, and near-term earnings expectations.
However, markets frequently discount information before it becomes visible in reported numbers. As a result, the more important question becomes whether market participants are using the news as a reason to distribute holdings or as an opportunity to accumulate positions at attractive structural levels.
The current chart suggests the latter possibility.
Despite the negative news flow, M&M generated a Bullish Engulfing pattern with a reliability score of 79.0%, while simultaneously attracting 3.18 million shares of volume, reflecting above-average participation and visible buying dominance.
From an institutional market structure perspective, this behaviour is noteworthy because the reversal signal is occurring near the lower boundary of a multi-month trading range.
The market is effectively communicating three important observations:
Negative news has not produced a structural breakdown.
Buyers continue to defend the lower range region.
Price is attempting stabilization despite weakening sentiment.
This creates what technicians often refer to as a fundamental disconnect, where headline news remains negative while price behaviour begins showing signs of stabilization.
The significance of the Bullish Engulfing pattern increases because it appears within a Lower Range Consolidation environment, where downside momentum is already showing signs of exhaustion.
While the broader trend remains technically weak, the current setup suggests that institutional participants may be selectively accumulating exposure while market sentiment remains cautious.
________________________________________
2. Multi-Day Swing Architecture
The current swing framework revolves around the Reference Entry Zone at ₹3,128.15.
This level represents the primary technical decision area for the ongoing recovery attempt.
At present, the stock remains below the reference zone, indicating that the reversal signal has emerged but has not yet transitioned into full confirmation. The objective for bulls is not merely to sustain the Bullish Engulfing pattern but to establish acceptance above the reference area.
Reference Entry Zone
₹3,128.15
A sustained move toward and above this level would signal improving market acceptance and strengthen the probability that the current recovery extends beyond a short-term reaction.
________________________________________
First Objective
Resistance 1 (R1): ₹3,041.93
This represents the nearest supply zone and the first technical hurdle within the recovery process.
________________________________________
Secondary Objective
Resistance 2 (R2): ₹3,082.97
A move through this region would indicate increasing buyer commitment and continued structural repair.
________________________________________
Primary Swing Objective
Resistance 3 (R3): ₹3,153.73
This level carries elevated significance because it sits slightly above the reference framework and would demonstrate that the market is successfully overcoming recent supply pressure.
________________________________________
Macro Structural Objective
Higher Range: ₹3,399.00
The broader technical ceiling remains located near ₹3,399.00.
A successful progression toward this zone would represent a substantial improvement in structure and would effectively signal a transition from recovery into trend restoration.
From a technical perspective, the journey from the current lower-range environment toward ₹3,399 would require multiple layers of confirmation, including improving momentum indicators and sustained participation.
________________________________________
3. Risk Mitigation & Support Grids
Although the Bullish Engulfing pattern provides a constructive signal, risk management remains essential because several momentum indicators continue to show caution.
Current indicator conditions include:
RSI: 43.92 (below neutral equilibrium)
MACD: -46.98 (bearish momentum remains present)
Bollinger Bands: Compression phase (BB Squeeze)
Trend Structure: Weakening Downtrend
Market State: Lower Range Consolidation
These conditions suggest that the market is attempting stabilization but has not yet completed a full trend reversal.
________________________________________
Support Infrastructure
Support 1
₹2,930.13
The nearest support level and the first area expected to attract buyers during any pullback.
Support 2
₹2,859.37
A more significant support zone that would become relevant if the recovery loses momentum.
Support 3
₹2,818.33
The final major structural support visible within the current framework.
Lower Range
₹2,900.40
This level represents the broader accumulation zone currently supporting price.
________________________________________
Technical Invalidation
Stop Loss
₹2,919.25
This level serves as the primary technical invalidation point for the current swing setup.
A decisive breakdown below this level would indicate that the lower-range accumulation thesis is failing and that sellers have regained control of the market structure.
________________________________________
Position Sizing & Risk Profile
The current setup carries a defined risk of:
₹115.10 per share
This is a relatively wide risk parameter and therefore requires disciplined capital allocation.
Professional traders typically adjust position size according to predefined risk exposure rather than increasing exposure based solely on conviction. The wider the stop distance, the smaller the position size required to maintain consistent portfolio risk.
The presence of a Bollinger Band Squeeze adds another layer of importance to risk management.
Compression environments often precede volatility expansion. While the eventual expansion may occur in favour of the reversal pattern, technicians must acknowledge that compressed markets can produce sharp directional moves in either direction.
As a result, maintaining strict adherence to predefined invalidation levels remains critical.
________________________________________
Technical Conclusion
Mahindra & Mahindra currently represents a compelling example of technical behaviour diverging from short-term fundamental sentiment.
While recent production disruptions and labour-related supply constraints have introduced negative headlines, price action has thus far resisted a broader breakdown. Instead, the stock has formed a Bullish Engulfing pattern with 79.0% reliability, supported by 3.18 million shares of volume and visible buying dominance.
The market remains within a weakening downtrend and several momentum indicators continue to require improvement. However, the combination of lower-range stabilization, expanding participation, and Bollinger Band compression suggests that the stock may be entering an important structural inflection phase.
The immediate focus remains on the progression toward the ₹3,128.15 reference zone, while the broader technical framework continues to monitor the pathway through ₹3,041.93, ₹3,082.97, and ₹3,153.73, ultimately extending toward the higher-range ceiling at ₹3,399.00.
Until additional confirmation emerges, the setup should be viewed as a developing recovery attempt supported by improving participation rather than a fully established trend reversal.
________________________________________
Educational Disclaimer
This analysis is provided solely for educational and informational purposes and reflects a technical interpretation of price action, market structure, volume behaviour, and publicly known developments. It does not constitute investment advice, a recommendation, or a solicitation to buy or sell any financial instrument. Market conditions can change rapidly, and technical patterns do not guarantee future outcomes. Investors and traders should conduct their own independent research and consult a SEBI-registered investment advisor before making any investment or trading decisions.
 Long
Long
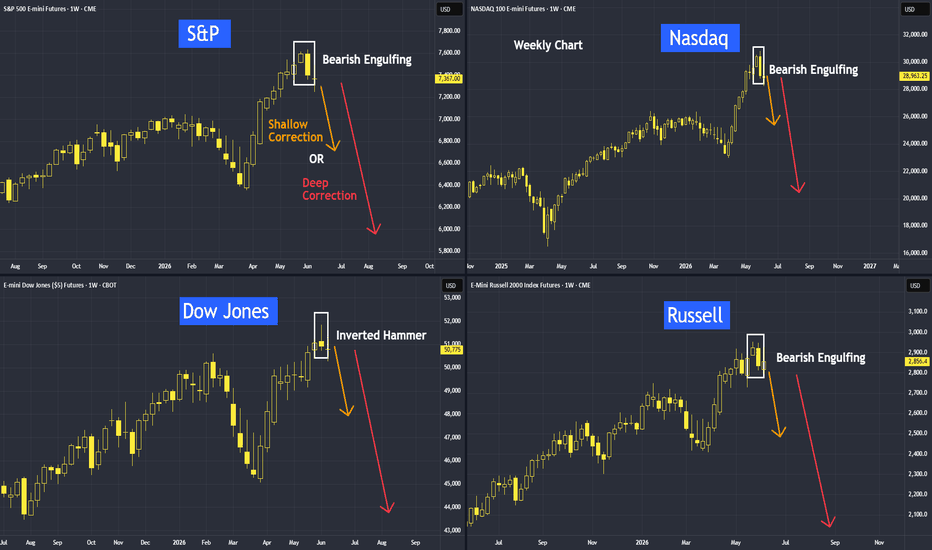
Will US Reversals Hold?As of last week's close, all major US indices completed their weekly movements, and all of them indicated a reversal pattern.
S&P 500, Nasdaq, and Russell 2000 all formed a bearish engulfing pattern, while the Dow Jones formed an inverted hammer.
So, is a correction coming?
Based on these technical studies, a correction appears to be developing.
We will discuss how to manage these risks and whether this correction will be shallow or deep.
Micro E-mini S&P 500 Index Futures & Options
Code: MES
Minimum fluctuation
0.25 index points = $1.25
Disclaimer:
• What presented here is not a recommendation, please consult your licensed broker.
• Our mission is to create lateral thinking skills for every investor and trader, knowing when to take a calculated risk with market uncertainty and a bolder risk when opportunity arises.
CME Real-time Market Data help identify trading set-ups in real-time and express my market views. If you have futures in your trading portfolio, you can check out on CME Group data plans available that suit your trading needs www.tradingview.com
 Long
Long
Short 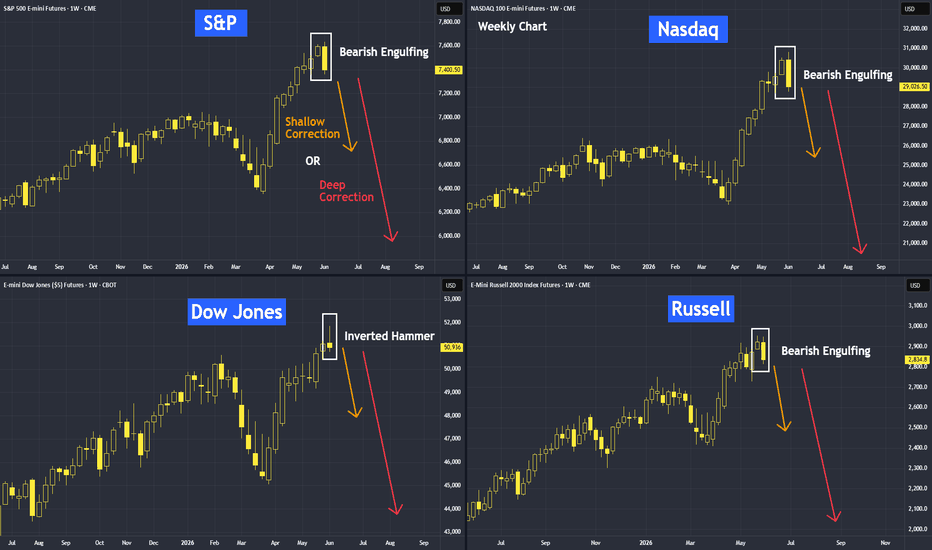
 Short
Short
 Short
Short
The Art of Building a Position: Scaling In Meeting Scaling OutOne of the greatest challenges traders face is not necessarily identifying a potential opportunity, but rather determining how to participate in it. Markets rarely move in straight lines, and even when the broader directional bias appears well defined, price can still retrace, consolidate, or test key levels before continuing its move.
This reality often creates a difficult dilemma. Enter too aggressively and risk poor timing, or wait for confirmation and risk missing part of the move altogether.
Rather than focusing exclusively on finding the perfect entry or exit, some traders choose to focus on trade construction. Scaling into a position and scaling out of a position are two techniques designed to help manage uncertainty by spreading decisions across multiple predefined price levels.
The current setup in Natural Gas futures provides an interesting case study to explore these concepts.
The Technical Picture
The weekly chart currently presents several constructive elements that may support a bullish scenario.
First, the MACD indicator has recently produced a bullish crossover on the weekly timeframe. While momentum indicators are inherently lagging by nature, they can still provide useful confirmation when combined with other forms of analysis. A bullish crossover often reflects improving momentum and may suggest that market participants are beginning to shift from a defensive posture toward a more constructive one.
That signal is reinforced by a bullish engulfing candlestick pattern that developed at the close of the most recent week. Bullish engulfing formations are commonly monitored because they indicate that buyers were able to absorb selling pressure and finish the period with stronger conviction than sellers.
Supporting this development is a Buy UFO support zone located between 2.883 and 2.676. The appearance of bullish price action immediately after a reaction from this support area suggests that this zone may have played a role in attracting demand.
Another notable feature is the existence of a small opening gap above the previous weekly close near 3.290. While gaps do not necessarily need to be filled immediately, they often become reference points that traders monitor as markets evolve.
Looking higher, two relevant resistance areas stand out.
The first is located at 3.736, representing the end of a significant open weekly gap. The second is located at 4.354, representing the origin of that same weekly gap. Both levels may attract attention from market participants and could potentially act as resistance zones should prices continue higher.
Taken together, the bullish engulfing pattern, the MACD crossover, the nearby support structure, and the opening gap create a constructive technical backdrop. At the same time, the presence of multiple support and resistance levels highlights why trade management can be just as important as market direction.
Why Single Entries and Single Exits Can Be Challenging
Many traders naturally gravitate toward all-or-nothing decisions.
They enter a full position at one price and aim to exit the entire position at a single target.
While simple, this approach assumes a level of precision that markets do not always provide.
Even when a broader bullish thesis remains intact, price may retrace before advancing. Likewise, a market may reach an intermediate resistance level, pause, and then continue higher.
This uncertainty is one reason why scaling techniques have become popular among traders seeking a more structured approach to position management.
Rather than attempting to identify a perfect price, scaling methods recognize that markets often evolve through multiple stages.
The Concept of Scaling In
Scaling in refers to entering a position gradually rather than all at once.
Instead of allocating all capital at a single level, traders may divide their intended exposure across several predefined entry zones.
Using the current Natural Gas setup as an educational example, a trader with a bullish thesis might consider several potential participation areas.
An initial allocation could be established near current market levels.
If price were to revisit the opening gap area near 3.290, an additional allocation could potentially be added.
Should a deeper retracement occur, another allocation might be considered near the Buy UFO support zone around 2.883.
The key principle is that every allocation is planned in advance and tied to a single market thesis.
In this case, the thesis remains valid as long as price continues to respect the broader support structure. A move below 2.676 would represent a potential invalidation level for the overall setup.
Scaling in offers several potential advantages.
It may improve the average entry price if the market retraces before advancing.
It reduces the pressure associated with perfect timing.
It allows traders to participate immediately while still preserving flexibility should additional opportunities emerge.
However, scaling in also introduces additional complexity.
Without careful position sizing, traders may unintentionally increase risk beyond acceptable limits. This is why total exposure should be determined before the first entry is placed rather than after the market begins moving.
The Concept of Scaling Out
Scaling out applies the same philosophy to exits.
Rather than liquidating an entire position at a single target, traders may choose to reduce exposure progressively as price approaches predefined objectives.
Using the current chart structure, a trader might identify 3.736 as a first objective and 4.354 as a secondary objective.
If the market reaches the first target, a portion of the position could potentially be reduced while maintaining exposure to the remainder of the trade.
Should the market continue higher, the remaining position could then be managed toward the second target.
This approach offers several potential benefits.
Partial reductions can help lock in gains while preserving participation in a continued move.
Scaling out may also reduce emotional pressure because traders no longer face an all-or-nothing decision at a single price level.
At the same time, scaling out involves trade-offs.
If the market accelerates significantly beyond the planned targets, a partially reduced position may capture less of the extended move than a full position would have.
As with all trade management decisions, there is no universally correct solution. The objective is to create a framework that aligns with the trader's goals, risk tolerance, and methodology.
When Scaling In Meets Scaling Out
The most interesting application occurs when both techniques are combined into a single trade plan.
Instead of focusing on one entry and one exit, traders create a roadmap consisting of multiple predefined decision points.
For example, an educational trade scenario based on the current setup might include:
Initial participation near current levels.
Additional participation near 3.290 if reached.
Additional participation near 2.883 if reached.
Partial reduction near 3.736.
Final reduction near 4.354.
Overall trade invalidation below 2.676.
This type of structure does not eliminate uncertainty.
Rather, it attempts to organize uncertainty into a series of predefined actions.
By determining responses before the market reaches those levels, traders may reduce the likelihood of emotional decision-making during periods of heightened volatility.
The emphasis shifts from prediction toward preparation.
Illustrative Trade Scenario
As an educational case study, the current technical structure may be viewed through the lens of a bullish market thesis.
The bullish engulfing pattern and weekly MACD crossover suggest improving momentum.
The opening gap near 3.290 and the Buy UFO support zone near 2.883 provide potential reference areas where buyers may remain interested.
Meanwhile, resistance levels at 3.736 and 4.354 provide logical areas where market participants may reassess positions.
One possible illustration would involve gradually building exposure between current levels and support while gradually reducing exposure as price approaches resistance.
Using this framework, traders can evaluate potential reward relative to the distance between planned entries and the invalidation level.
Importantly, this remains a hypothetical example designed solely to illustrate trade management principles. Market outcomes remain uncertain, and no technical signal guarantees future price behavior.
Natural Gas Futures, E-mini Natural Gas Futures and Micro Natural Gas Futures
For traders interested in implementing scaling techniques, contract size can play an important role.
Natural Gas futures provide exposure to the underlying market through standardized contracts traded on CME Group exchanges.
The standard Natural Gas futures contract (NG) represents 10,000 MMBtu of natural gas. The E-mini Natural Gas futures contract (QG) represents 2,500 MMBtu. And, the Micro Henry Hub Natural Gas futures contract (MNG) represents 1,000 MMBtu, making it one-tenth the size of the standard contract.
Because the E-mini and the micro contracts carry smaller notional exposure, some traders may find it useful when constructing positions across multiple entry levels.
For example, scaling into a trade using micro contracts may allow more flexibility when adjusting exposure incrementally.
Natural Gas futures (NG)
Tick = 0.00025 = $2.50 per contract
Margin = ~$3,100 per contract
E-mini Natural Gas futures (QG)
Tick = 0.005 = $12.50 per contract
Margin = ~$775 per contract
Micro Natural Gas futures (MNG)
Tick = 0.00025 = $0.25 per contract
Margin = ~$310 per contract
Margin requirements vary over time based on market conditions and exchange policies. Traders should always consult their brokerage firm for current margin information before establishing any futures position.
Regardless of contract size, the underlying principles of risk management remain unchanged.
Risk Management: The Foundation of Every Trade Plan
Scaling techniques should never be confused with risk management itself.
They are tools that operate within a risk management framework.
Before considering entries, targets, or position adjustments, traders should first determine the maximum amount of capital they are willing to risk on a particular idea.
The invalidation point should be identified before the first position is initiated.
Total exposure should be planned in advance.
Each scale-in level should be accounted for within the original risk budget.
Likewise, scaling out should be viewed as a trade management decision rather than a guarantee of improved performance.
The ultimate objective is consistency of process.
A well-constructed plan allows traders to respond systematically regardless of whether the market advances immediately, retraces first, or invalidates the original thesis altogether.
Key Takeaways
The current Natural Gas futures setup presents an interesting educational example because it combines multiple forms of technical evidence with clearly defined support and resistance levels.
The weekly MACD bullish crossover, bullish engulfing candlestick pattern, opening gap near 3.290, and Buy UFO support zone collectively support a constructive market narrative. Meanwhile, resistance levels at 3.736 and 4.354 provide logical reference points for managing positions should prices continue higher.
More importantly, this setup highlights a broader lesson that extends far beyond a single market.
Scaling in and scaling out are not attempts to predict the future with greater accuracy. They are methods designed to structure participation in an environment where uncertainty is unavoidable.
In many cases, the art of trading may have less to do with finding the perfect entry and more to do with building a position thoughtfully from beginning to end.
Data Consideration
When charting futures, the data provided could be delayed. Traders working with the ticker symbols discussed in this idea may prefer to use CME Group real-time data plan on TradingView: www.tradingview.com - This consideration is particularly important for shorter-term traders, whereas it may be less critical for those focused on longer-term trading strategies.
General Disclaimer
The trade ideas presented herein are solely for illustrative purposes forming a part of a case study intended to demonstrate key principles in risk management within the context of the specific market scenarios discussed. These ideas are not to be interpreted as investment recommendations or financial advice. They do not endorse or promote any specific trading strategies, financial products, or services. The information provided is based on data believed to be reliable; however, its accuracy or completeness cannot be guaranteed. Trading in financial markets involves risks, including the potential loss of principal. Each individual should conduct their own research and consult with professional financial advisors before making any investment decisions. The author or publisher of this content bears no responsibility for any actions taken based on the information provided or for any resultant financial or other losses.  Education
RELIANCE – Technical & Educational Snapshot📊 RELIANCE – Technical & Educational Snapshot
Ticker: NSE: RELIANCE
Sector: ⛽ Energy / Conglomerate
CMP: 1,359.70 ▲ (+2.80% | 20 May 2026)
Learning Rating: ⭐⭐⭐⭐☆ (Recovery Attempt Inside Broader Range Structure)
Chart Pattern Observed: 📊 Corrective Pullback → Stabilisation → Recovery Bounce
Candlestick Pattern Observed: Bullish Engulfing
📊 Technical Snapshot
RELIANCE is showing an early-stage recovery attempt after facing sustained corrective pressure near higher supply zones. Recent price action reflects stabilisation near lower demand regions, with the latest bullish engulfing candle indicating renewed buying interest after a period of weakness. RSI is currently placed near 46.6, suggesting that momentum is recovering from weaker territory rather than entering overheated conditions, leaving room for continuation if follow-through buying emerges. MACD remains slightly negative but is showing signs of stabilisation, indicating that bearish pressure may be slowing after the recent decline. Bollinger Bands are beginning to contract after elevated volatility, reflecting possible range formation before the next directional move. Price is now attempting to reclaim nearby resistance levels, and sustained acceptance above these zones may support broader recovery continuation.
📊 Volume Analysis
🔹 Current Volume: ~13.25M
🔹 Average Volume (20-period): ~19.69M ⚠️
📉 Volume remains below average despite the bullish recovery candle.
💡 Interpretation: Recovery moves supported by lower participation often indicate cautious buying activity rather than aggressive institutional accumulation. Stronger participation near resistance zones would improve continuation confirmation.
🔑 Key Levels – Daily Timeframe
Support Areas: 1327 | 1294 | 1276
Resistance Areas: 1377 | 1395 | 1427
These are zones where price has paused or reacted earlier.
📉 Pullback Zones (Chart-Based Observation)
Healthy Pullback Zone 1: 1345 – 1337
Healthy Pullback Zone 2: 1327 – 1294
Deep Pullback Support Zone: 1276 Area
💡 Pullbacks holding above recovery zones may support continuation momentum, while deeper retracement below support can weaken the recovery structure temporarily.
What’s Catching Our Eye: Bullish engulfing candle emerging near lower support zones.
What to Watch For: Sustained acceptance above the 1377 resistance zone.
Failure Zone: Sustained weakness below 1327 weakens recovery structure.
Risks to Watch: Weak participation and rejection near overhead supply zones.
What to Expect Next: Recovery continuation with range-bound behaviour possible.
Bullish Case: Strength above resistance may support fresh upside expansion.
Bearish Case: Failure near resistance may trigger renewed consolidation pressure.
Momentum Case: Momentum recovering gradually but requires stronger confirmation.
STWP Equity Snapshot – RELIANCE
Reference Setup:
Reference: 1,362.9
Invalidation Level: 1,310.9
Upside Reference 1: 1,414.8
Upside Reference 2: 1,466.7
STWP View:
• Sentiment: Recovery Neutral | Trend: Broad Range Structure
• RSI: 46.62 (Neutral Recovery Zone)
• Volume: Below Average Participation
• Structure: Bullish Recovery Attempt
Final Outlook
Momentum: Moderate
Trend: Range to Recovery
Risk: Moderate
Volume: Low to Moderate
Learning Note: Recovery structures become stronger when bullish reversal candles are supported by improving participation near resistance zones.
Disclaimer:
This analysis is generated strictly for educational and analytical purposes only.
This does NOT constitute investment advice, trading advice, or a recommendation to buy or sell any security or derivative instrument.
Options trading involves substantial risk and may not be suitable for all participants.
Readers are advised to exercise independent judgment and consult a SEBI-registered financial advisor before taking any trading or investment decisions.
STWP assumes no responsibility for any financial loss arising from the use of this analysis.
💬 Recovery continuation or temporary bounce — what does the structure suggest to you?
🔼 Boost | ✍️ Comment | 🔁 Share with a learner
👉 Follow STWP for clean chart-reading insights
🚀 Stay Calm. Stay Clean. Trade With Patience.  Long
Long
ABB – Technical & Educational Snapshot📊 ABB – Technical & Educational Snapshot
Ticker: NSE: ABB
Sector: ⚙️ Industrial Automation / Engineering
CMP: 6,605.00 ▲ (+4.36% | 20 May 2026)
Learning Rating: ⭐⭐⭐⭐☆ (Recovery Momentum Near Resistance Zone)
Chart Pattern Observed: 📊 Pullback → Stabilisation → Recovery Attempt
Candlestick Pattern Observed: Bullish Engulfing
📊 Technical Snapshot
ABB is showing a recovery attempt after witnessing corrective pressure from higher supply zones, with recent price action indicating renewed buying interest near important support levels. The latest bullish engulfing candle reflects strong short-term recovery momentum as buyers attempt to reclaim lost ground near resistance clusters. RSI is currently placed near 46.8, indicating that momentum is recovering from neutral territory rather than entering overheated conditions, leaving room for continuation if supported by follow-through buying activity. MACD remains weak but is gradually stabilising, suggesting that bearish pressure may be slowing after the recent decline. Bollinger Bands are beginning to contract after elevated volatility, reflecting possible consolidation before the next directional move. Price is now approaching an important resistance zone near prior reaction highs, and sustained acceptance above these levels may strengthen the recovery structure further.
📊 Volume Analysis
🔹 Current Volume: ~546K
🔹 Average Volume (20-period): ~554K ⚠️
📉 Volume remains near average despite the recovery candle.
💡 Interpretation: Recovery moves supported by average participation may indicate cautious buying activity rather than aggressive institutional accumulation. Stronger participation near resistance zones would improve confirmation strength.
🔑 Key Levels – Daily Timeframe
Support Areas: 6368 | 6131 | 6003
Resistance Areas: 6732 | 6860 | 7097
These are zones where price has paused or reacted earlier.
📉 Pullback Zones (Chart-Based Observation)
Healthy Pullback Zone 1: 6496 – 6441
Healthy Pullback Zone 2: 6368 – 6212
Deep Pullback Support Zone: 6003 Area
💡 Pullbacks holding above recovery zones may support continuation momentum, while deeper retracement below support can weaken the recovery structure temporarily.
What’s Catching Our Eye: Strong bullish engulfing candle after corrective pressure.
What to Watch For: Sustained acceptance above the 6732 resistance zone.
Failure Zone: Sustained weakness below 6368 weakens recovery structure.
Risks to Watch: Weak participation and rejection near overhead supply zones.
What to Expect Next: Recovery continuation with range-based movement possible.
Bullish Case: Strength above resistance may support fresh upside expansion.
Bearish Case: Failure near resistance may trigger renewed consolidation pressure.
Momentum Case: Momentum recovering but requires stronger participation confirmation.
STWP Equity Snapshot – ABB
Reference Setup:
Reference: 6,624
Invalidation Level: 6,212
Upside Reference 1: 7,035
Upside Reference 2: 7,446
STWP View:
• Sentiment: Recovery Positive | Trend: Uptrend Weakening
• RSI: 46.8 (Neutral Recovery Zone)
• Volume: Average Participation
• Structure: Bullish Recovery Attempt
Final Outlook
Momentum: Moderate
Trend: Developing Recovery
Risk: Moderate to High
Volume: Average
Learning Note: Recovery structures become stronger when bullish reversals are supported by improving participation near resistance zones.
Disclaimer:
This analysis is generated strictly for educational and analytical purposes only.
This does NOT constitute investment advice, trading advice, or a recommendation to buy or sell any security or derivative instrument.
Options trading involves substantial risk and may not be suitable for all participants.
Readers are advised to exercise independent judgment and consult a SEBI-registered financial advisor before taking any trading or investment decisions.
STWP assumes no responsibility for any financial loss arising from the use of this analysis.
💬 Recovery continuation or temporary bounce — what does the structure suggest to you?
🔼 Boost | ✍️ Comment | 🔁 Share with a learner
👉 Follow STWP for clean chart-reading insights
🚀 Stay Calm. Stay Clean. Trade With Patience.  Long
Long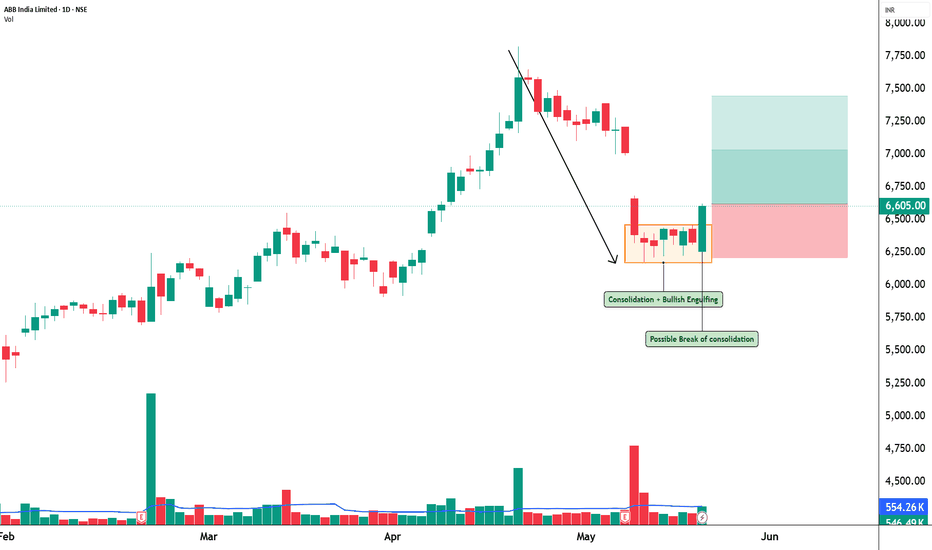
KRN – Momentum Expansion Near Resistance with Bullish Engulfing📊 KRN Heat Exchanger Ltd – STWP Equity Snapshot
Ticker: NSE: KRN
Sector: Industrial / Engineering
CMP: 1,284 ▲ (+6.82%)
Learning Rating: ⭐⭐⭐⭐☆ (Momentum Expansion Near Resistance)
Chart Pattern Observed: Strong Impulse Move → Short-Term Consolidation
Candlestick Context: Bullish Engulfing with Follow-through Strength
🔑 Key Levels – Daily Timeframe
Support Areas: 1,217 | 1,151 | 1,112
Resistance Areas: 1,322 | 1,361 | 1,427
These are zones where price has paused or reacted earlier.
📊 Volume Analysis
Above-average volume during the impulsive move signals active participation, but slight cooling near resistance suggests temporary exhaustion.
📍 Price Reference Framework
Intraday:
Reference: 1,295
Invalidation: 1,180
Upside Zones: 1,409 → 1,524
Swing:
Reference: 1,295
Invalidation: 1,107
Upside Zones: 1,670 → 1,951
🔄 Pullback / Opportunity Zones
1,220 – 1,200 → Immediate demand zone
1,150 – 1,120 → Strong structural support
Below 1,110 → Trend weakens
🎯 STWP View
Momentum remains positive with a strong bullish candle structure, but price is facing resistance overhead. A controlled pullback or consolidation here would strengthen continuation potential.
📌 Final Outlook
Momentum: Moderate | Trend: Up | Risk: High | Volume: Moderate
💡 Learning Note
Strong bullish engulfing near resistance often leads to either breakout or short consolidation — patience helps avoid chasing extended moves.
⚠️ Disclaimer
This analysis is generated strictly for educational and analytical purposes only.
This does NOT constitute investment advice, trading advice, or a recommendation to buy or sell any security or derivative instrument. Readers are advised to exercise independent judgment and consult a SEBI-registered financial advisor before taking any trading or investment decisions. STWP assumes no responsibility for any financial loss arising from the use of this analysis.  Long
Long
Long 
 Short
Short