Flag
AUDNZD: Valid Bull Flag?! 🇦🇺🇳🇿
AUDNZD violated a resistance line of a bullish flag pattern
on a 4H time frame.
I expect a bullish trend continuation now.
Goal will be 1.195
❤️Please, support my work with like, thank you!❤️
I am part of Trade Nation's Influencer program and receive a monthly fee for using their TradingView charts in my analysis.
Kraft Heinz: Potential Bear FlagKraft Heinz has been falling for years, and some traders may see further downside in the consumer staples giant.
The first pattern on today’s chart is the series of higher lows since late January. KHC closed below that rising line yesterday, which could be viewed as a bear-flag breakdown.
Second, the 50-day simple moving average (SMA) has remained below the 100-day SMA. You also have a series of lower highs since October. Those signals may reflect a longer-term downtrend.
Prices are under th
K
USDJPY: Strong Bullish Pattern 🇺🇸🇯🇵
There is a high probability that USDJPY will continue rising,
following a confirmed bullish breakout of a resistance line of a flag pattern.
Expect a rise at least to 157.8 level.
❤️Please, support my work with like, thank you!❤️
I am part of Trade Nation's Influencer program and receive a monthly fee for using their TradingView charts in my analysis.
GBPCHF: Bearish Move From Trend Line 🇬🇧🇨🇭
GBPCHF will likely drop lower after a test of a solid
falling trend line on a daily.
I expect a bearish continuation at least to 1.038 level.
❤️Please, support my work with like, thank you!❤️
I am part of Trade Nation's Influencer program and receive a monthly fee for using their TradingView charts in my analysis.
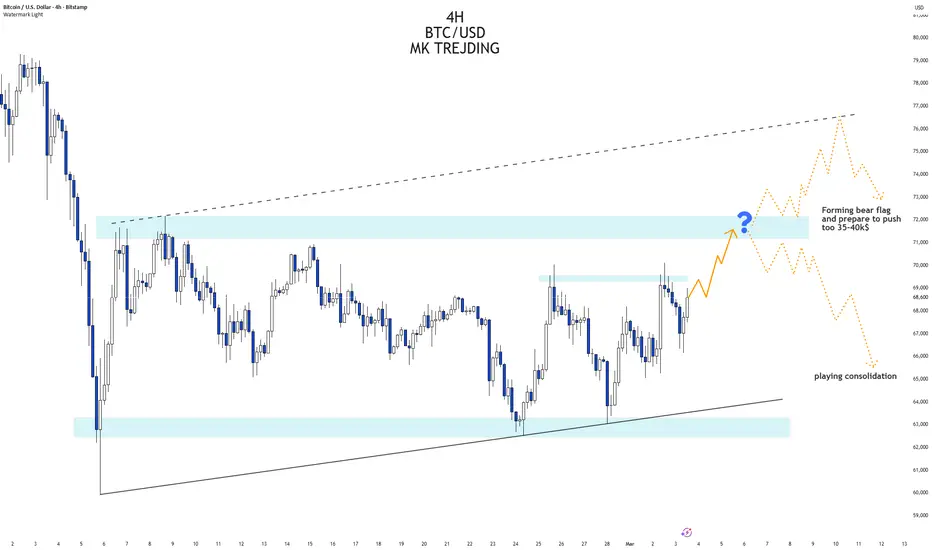
BTC ???BTC is not sure what he wants.
So far i see 2 possible scenarios
1)consolidation, we move to upper band and then reverse down
2)Bear FLAG projection line of possible price target of reversal and rally before major correction to lower lever for BTC 35-40k$.
In here it is difficult to predict any kind of direction. So we will se how the price will develop in next weeks.
Be safe!
Silver to $50On the above monthly chart Silver has corrected over 35% since the year began. A number of reasons now exist to begin accumulation. Why?
1) A ‘incredible buy’ signal prints. See weekly chart below. Not since September 2018 has such a strong signal like this printed.
2) A strong Dragonfly DOJI candle printed with the close of July. This told us $18 was very strong support.
3) Price action is printing within a bull flag. It could be another year before a breakout is seen, however, long positio
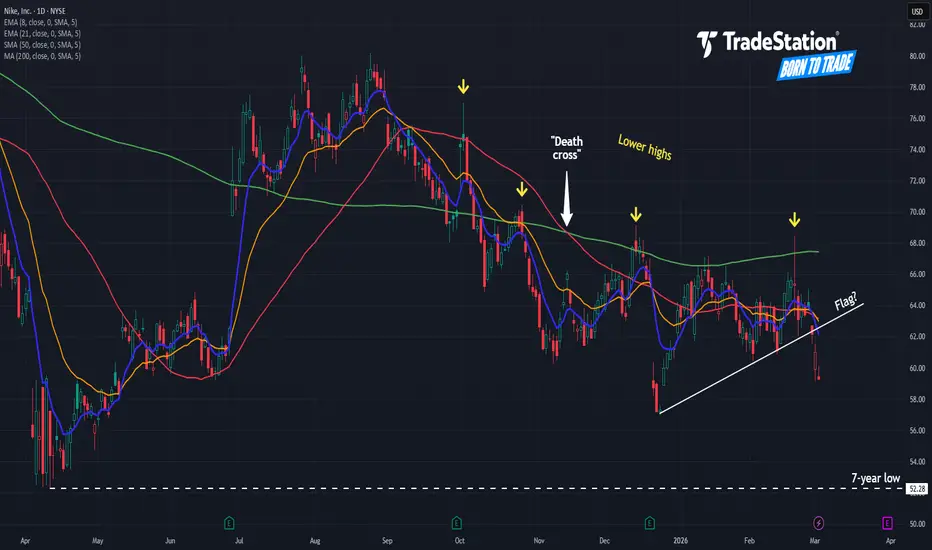
Nike May Be StaggeringNike has been staggering for months, and some traders may see downside risk.
The first pattern on today’s chart is the series of higher lows since late December. The footwear company closed below that line yesterday, which could be interpreted as a bear-flag breakdown.
Second, the series of lower highs since late 2025 (marked with yellow arrows) may reflect a longer-term downtrend.
Third, the 50-day simple moving average (SMA) had a “death cross” below the 200-day SMA in November. That could
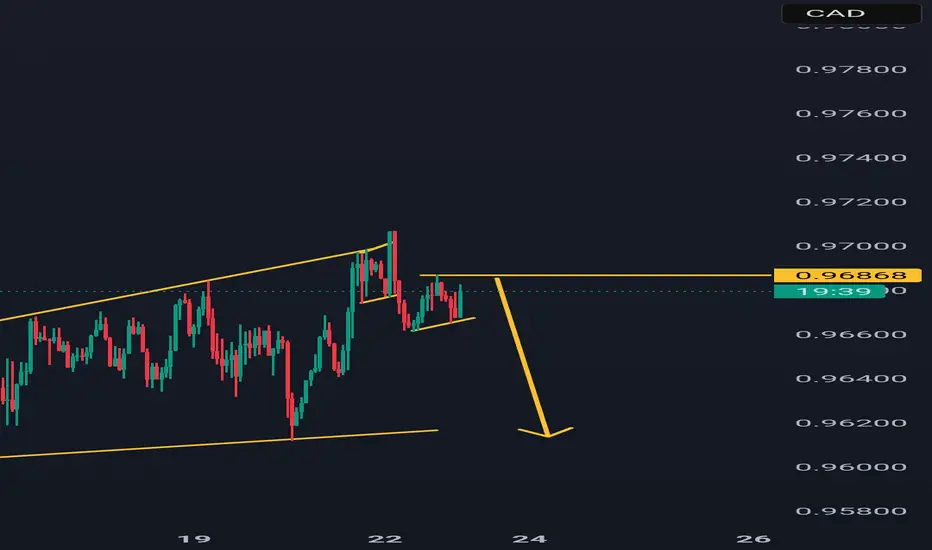
USDCHF: Another Bearish Wave Ahead?! 🇺🇸🇨🇭
USDCHF broke and closed below a support line of a bearish
flag pattern on a daily time frame.
It signifies a highly probable downtrend continuation.
Expect a fall at least to 0.765 support.
❤️Please, support my work with like, thank you!❤️
I am part of Trade Nation's Influencer program and receive a monthly fee for using their TradingView charts in my analysis.
Next week analysis on Gold Gold finally reached the previous high at the price of $5247.24 and broke it yesterday triggering the buyer's to excel in the market. Next week we looking for potential buys since gold prices have been consolidating, was able to break the resistance level at $5247.24 made a retest confirming Buy's next week until the prices hit the main resistance level at $5575.79
XAUUSD 4H IDEADue to market structure. Will go up to 32xx if break. Lets see. Not financial advice. DYOR
XLong
Bitcoin Near The Bottom?!Given the analysis here on the Weekly Chart, we can expect BITSTAMP:BTCUSD to continue falling to around the $57k - $55k.
Back in 2024, price on BITSTAMP:BTCUSD formed a Bull Flag and delivered a Bullish Breakout in November leading to price creating new All Time Highs.
The Breakout was never Retested!
After the sharp decline in 2025, price worked into an Ascending Channel ultimately forming a Bear Flag and delivered a Bearish Breakout to start 2026.
Based off the Flagpole ( 36% Drop ),
Btc appears 2 be breaking down from symmetrical triangle/pennatThe full bear pennant breakdown target is all the way at 40k however just the symmetrical triangle on its own is around 54k or so which is the exact target of the previous bear flag shown here with the dotted magenta line. There’s a chance it could finish dumping once it reached the full target of both the symmetrical triangle and the previous bearflag but if we are indeed inside a bear market currently then probability is high that it will also head to the current bear pennant breakdown target
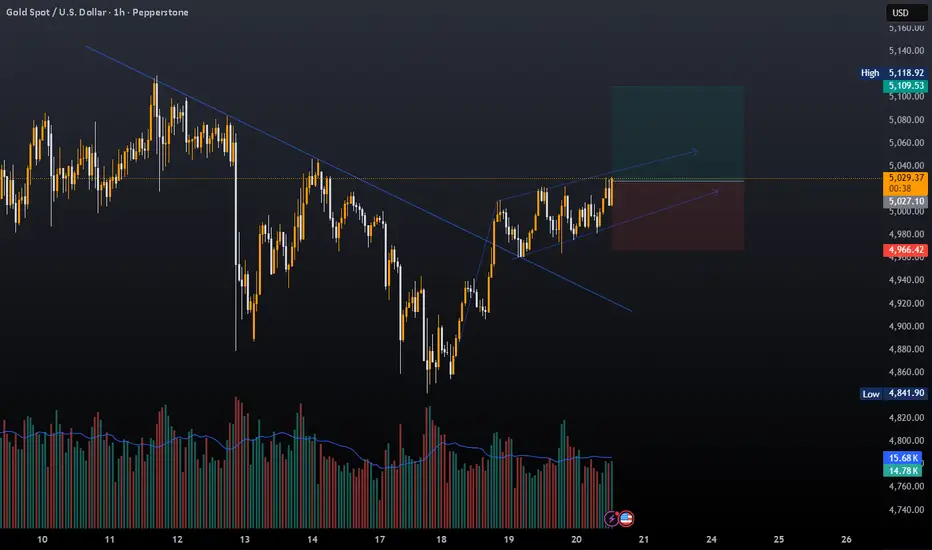
GOLD Flag and PoleGold has been consolidating for a long time. Now it has made a flag and pole in 1 hour time frame and a breakout of this pattern will pushed gold to 5060 5100 and further more. Hance one can look for entry in gold here and on dips until 5005 with strict SL of 4970.
Entry- 5028 or on dips till 5005.
Targets- 5060, 5100 and further more in trailing.
SL- 4970
Disclaimer- This is just for educational purpose.
JAI SHREE RAM