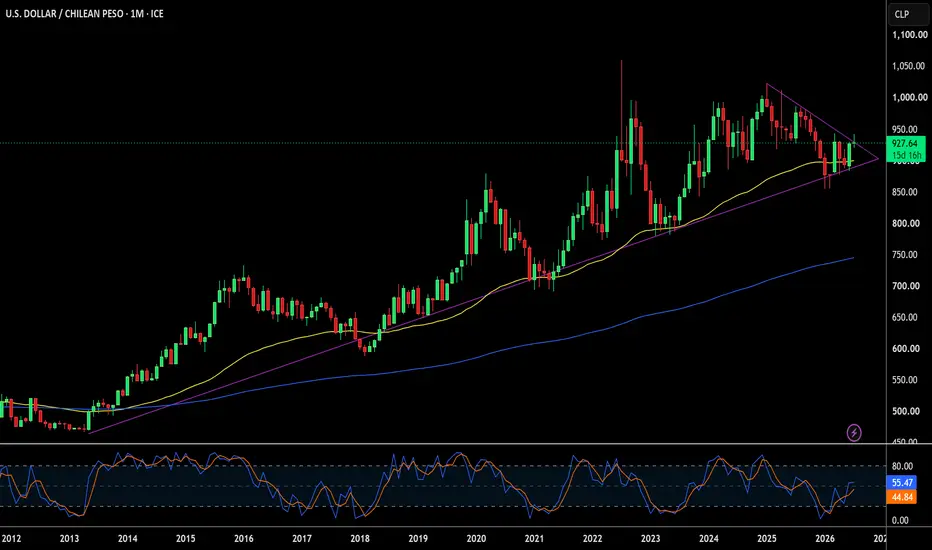
Is USD/CLP Just a Bet on Copper Prices?USD/CLP trades near 933 today, up almost 1% in a single session and roughly 4% weaker over the past month. ING's currency strategists see 940 to 950 as the summer ceiling. Their reasoning is simple: firm copper prices should cap the peso's downside even as energy costs rise elsewhere. That single sentence captures the entire Chilean peso story. This currency trades less like a sovereign FX pair and more like a copper derivative with a government attached.
Macroeconomics: A Currency on Autopilo
Investing
Will the Polish Zloty Unseat the Euro's Eastern Moat?The Illusion of Euro Dominance
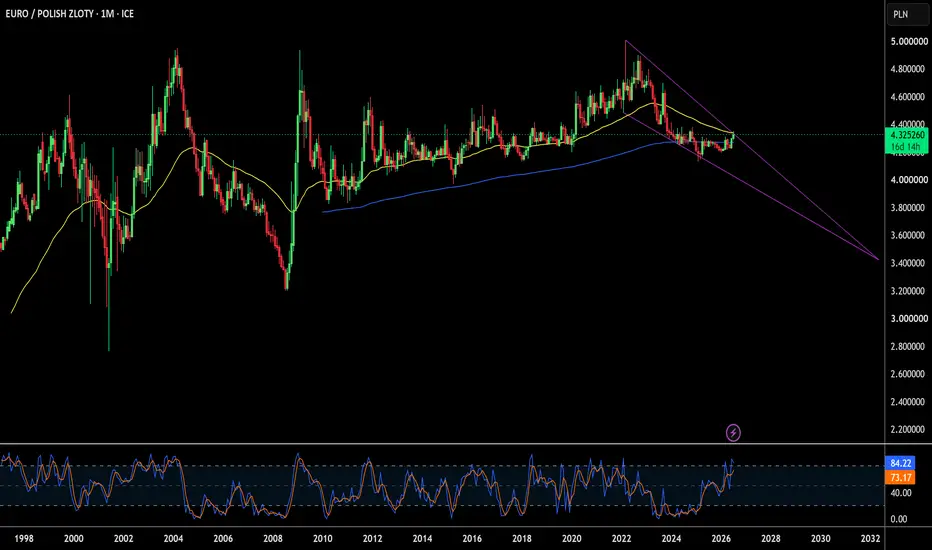
The EUR/PLN exchange rate sits at a fascinating crossroads in July 2026. Recent trading pushed the pair toward the 4.33 level. A dovish shift from the National Bank of Poland (NBP) triggered this temporary weakness. However, underlying economic fundamentals paint a vastly different picture.
The Eurozone faces structural stagnation. Germany expects a meager 0.6% GDP growth this year. France grapples with rising debt and 0.8% growth.
In contrast, Poland boasts a r
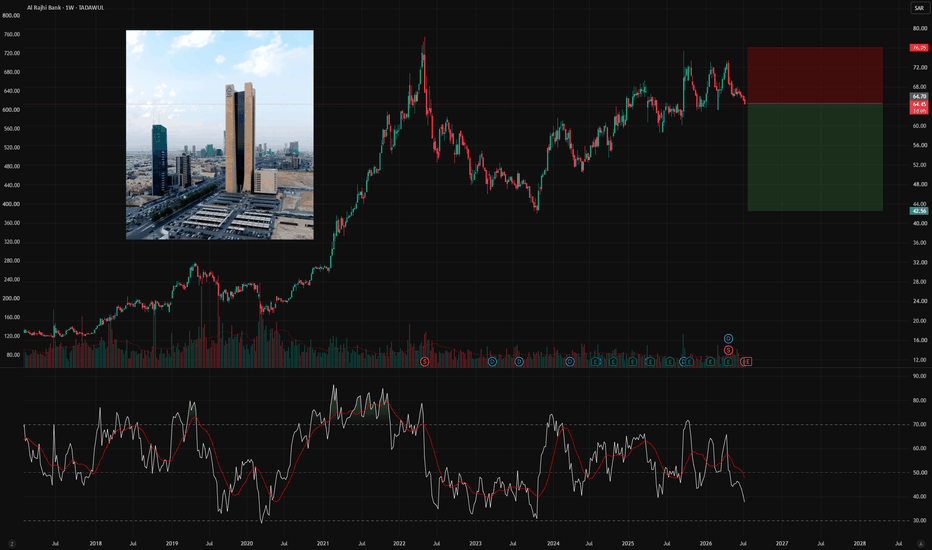
Al Rajhi Bank: Facing Liquidity and Regional HeadwindsDespite reporting solid Q1 2026 results, with a 14% growth in net profit, several systemic and macroeconomic risk factors could exert pressure on the stock in the medium term. Prolonged instability linked to the Iranian conflict represents a material risk for the entire Saudi banking sector. If the conflict were to escalate, Fitch warns that asset quality, profitability, and bank liquidity could contract, forcing an increase in provisions for credit losses (impairment charges). The sector is fac
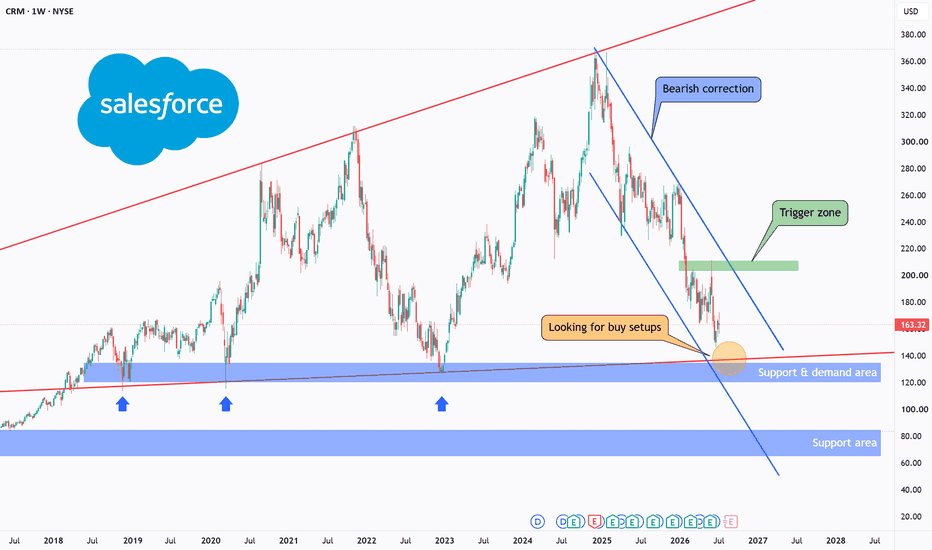
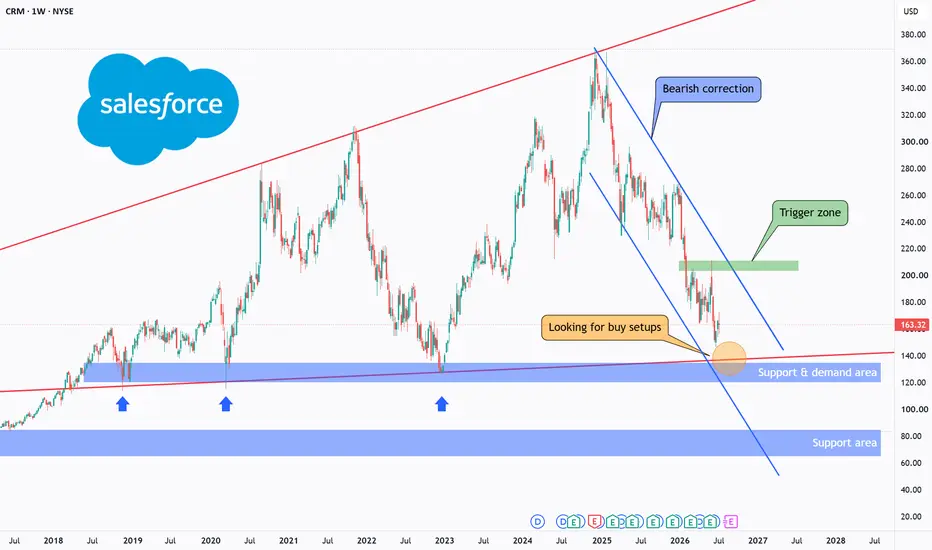
CRM - Long-Term Bullish Structure at Key Support!CRM (Salesforce, Inc.) is one of the world's leading cloud-based software companies, providing customer relationship management (CRM) solutions that help businesses manage sales, marketing, customer service, and business operations.
From a long-term perspective, the stock remains overall bullish, continuing to respect the red ascending broadening wedge that has guided price action since 2018.
The current decline appears to be a corrective phase, with price moving inside the blue descending ch
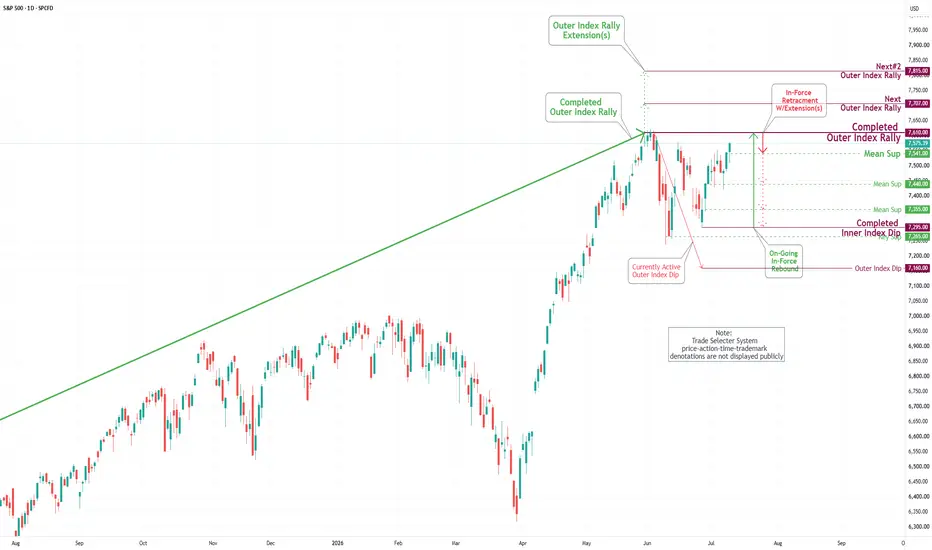
S&P 500 Daily Chart Analysis For Week of July 10, 2026Technical Analysis and Outlook:
In the previous week's trading session, the S&P 500 Index posted a substantial gain after successfully retesting the Mean Support level at 7,440. This led the Index to surpass the Mean Resistance level of 7,553.
Forecasts indicate that this vital Index is likely to continue its upward trajectory, with the potential to revisit the completed Outer Index Rally at 7,610. Furthermore, there is the possibility of extending to the subsequent Outer Index Rally levels of
EUR/USD Daily Chart Analysis For Week of July 10, 2026Technical Analysis and Outlook:
In last week’s trading session, the Eurodollar exhibited considerable volatility, oscillating between Mean Support at 1.138 and Mean Resistance at 1.147. The session concluded with a notable downward movement, pointing towards Mean Support 1.138, ultimately, with great fanfare, going deeper to hit the completed Inner Currency Dip 1.133.
On the other hand, currency players need to remain vigilant for a potential reversal from the current level, which could trigge
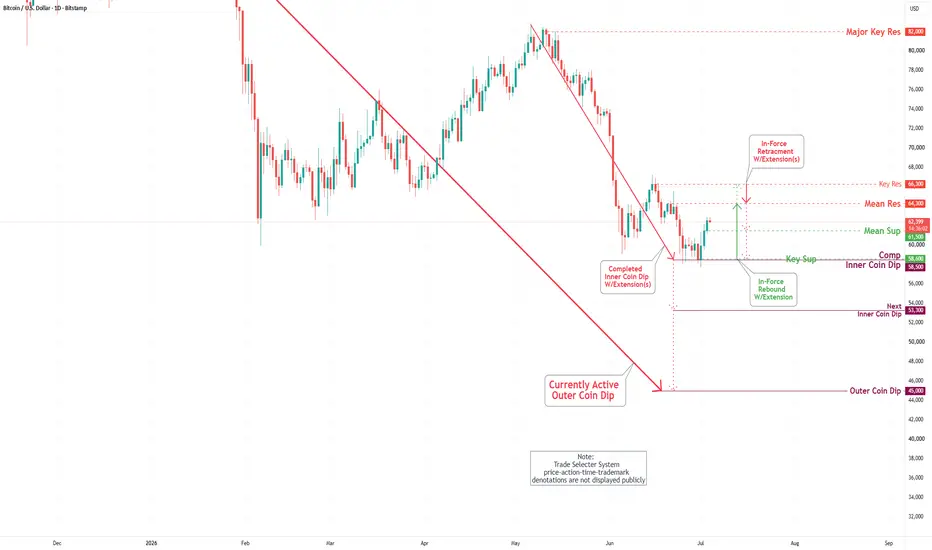
Bitcoin(BTC/USD) Daily Chart Analysis For Week of July 10, 2026Technical Analysis and Outlook:
In the trading session of the previous week, Bitcoin sustained its upward course after retesting the Mean Resistance level at $64,300. Subsequently, it experienced a pullback to the Mean Support at $61,500, which signals potential for further advancement toward the Key Resistance at $66,300 and may spur a move toward the Inner Coin Rally target of $69,500.
On the other hand, there is a growing expectation that the cryptocurrency may undergo a retracement, declin
Is Micron Too Strong for Burry's Short Bet?Famed investor Michael Burry just shorted the entire semiconductor industry. Through a massive bet against the iShares Semiconductor ETF, Burry targets top player Micron Technology. Micron ranks among the ETF's two largest holdings, essentially tied with AMD near the top. The company recently posted a staggering 345% revenue growth. It supplies vital high-bandwidth memory (HBM) for AI data centers. However, Burry questions the sustainability of this AI hardware spending spree. Will this short po
Netflix - Key Support Area Meets Long-Term Structure!Netflix (NFLX) remains overall bearish, continuing to trade inside the red descending broadening wedge that has been guiding the broader price structure.
Price is now testing a major technical area where the lower boundary of the wedge aligns with a strong weekly support zone around 70, creating an important region to monitor for a potential reaction.
⭕As long as this support area continues to hold, we can start looking for buy setups on lower timeframes, anticipating a move toward the upper
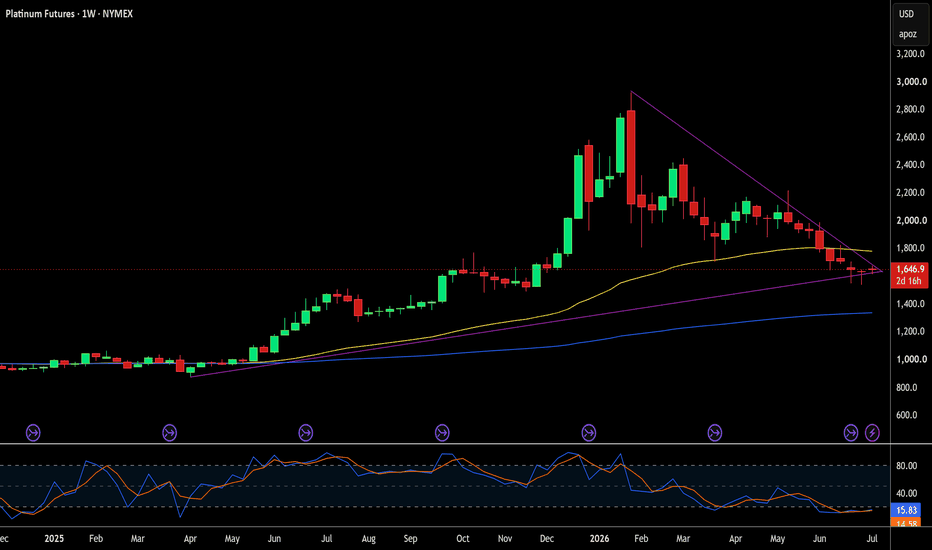
Platinum Futures: Igniting the Next Big MoveThe Dawn of a New Platinum Era
Investors constantly seek the next major market shift. Platinum futures present a compelling, multifaceted opportunity today. Prices have retraced from early 2026 record highs. This correction creates a prime entry point for strategic investors. The metal powers far more than just global jewelry. It serves as a critical linchpin across diverse sectors. Understanding platinum requires analyzing multiple interconnected global domains. We must actively explore geopo
SK Hynix Just Shocked Wall Street With a $28 Billion MoveSK Hynix is preparing for what could become the largest American Depositary Receipt (ADR) listing in history, targeting a raise of more than $28 billion on the Nasdaq
The offering would surpass Alibaba's roughly $22 billion U.S debut in 2014, with trading expected to begin around July 10 under the ticker SKHY. At first glance, it looks like a company raising capital to stay competitive.. In reality, SK Hynix is already operating from a position of exceptional strength. The company holds roughl
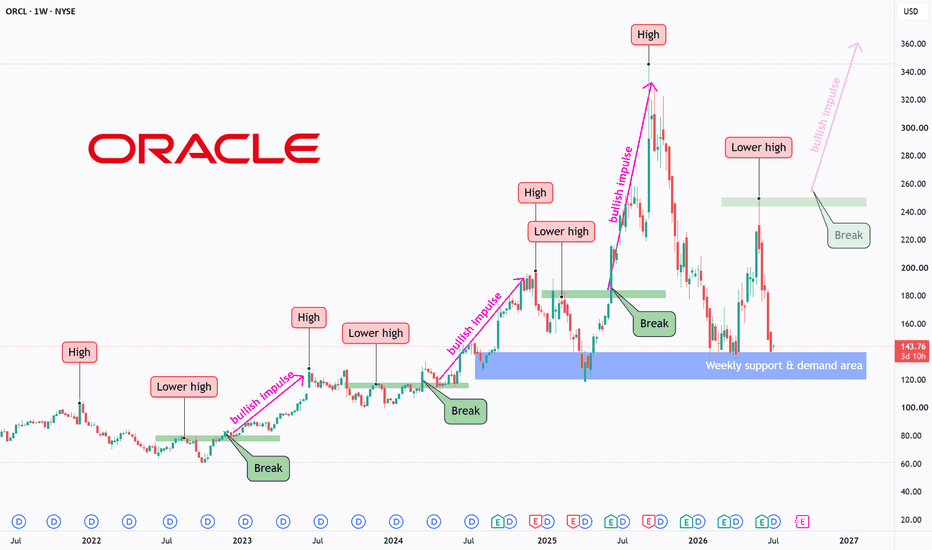
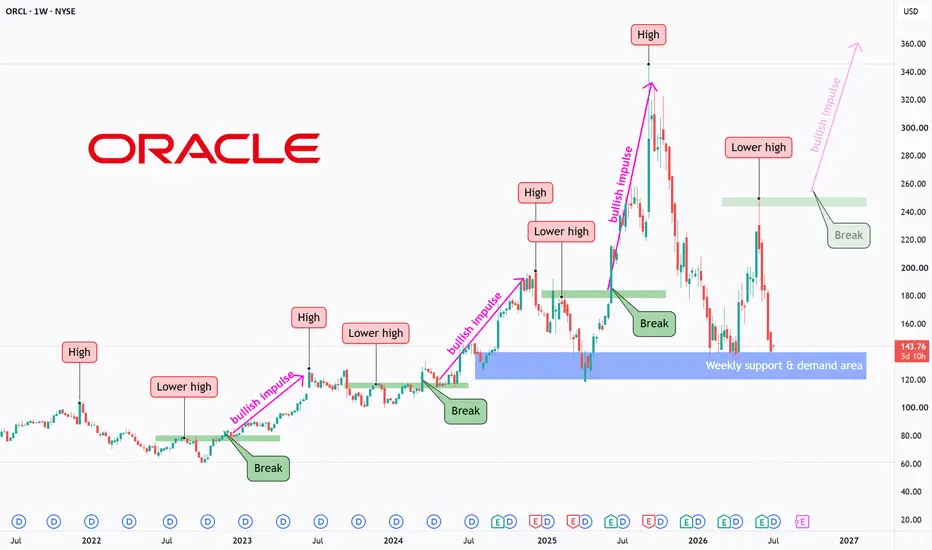
ORCL - History Repeating Itself?ORCL is one of the world's leading enterprise software and cloud computing companies, providing database solutions, cloud infrastructure, and AI-powered business applications. The stock has remained a popular long-term investment due to its strong market position and consistent business growth.
Looking at the broader price structure, an interesting pattern stands out. major highs followed by lower highs, and once those lower highs were broken, the stock entered strong bullish impulse moves.
P
Bad Jobs Data, Good Week For Stocks — The Chart Behind It.The June jobs report added 57,000 nonfarm payrolls against a 115,000 consensus estimate. Unemployment fell to 4.2% primarily on falling participation rather than genuine job creation. The S&P 500 gained 2% on the week as markets repriced the probability of a near-term rate hike lower.
The macro context for chart analysis Polymarket prices zero Fed rate cuts in 2026 at 79.8% probability. Goldman Sachs has pushed its rate cut forecast to June 2027. Rates are staying at 3.50% to 3.75% and the data
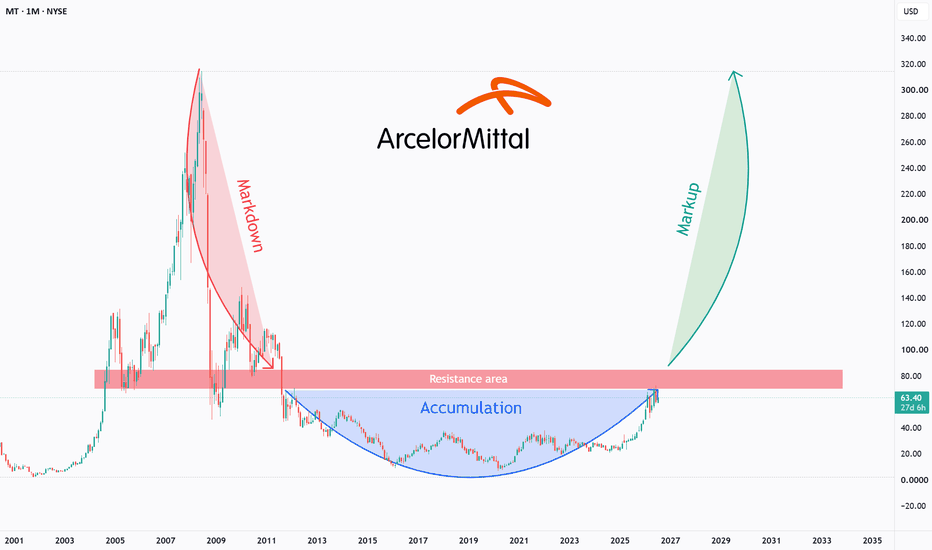
MT - Accumulation Near Completion?MT (ArcelorMittal) is one of the world's largest steel and mining companies, supplying steel products to industries including construction, automotive, infrastructure, and manufacturing. Given its global presence and cyclical nature, the stock is often followed from a long-term investment perspective.
From a technical standpoint, the broader structure appears to align well with Wyckoff Theory. Following a prolonged markdown phase, price has spent a long time developing what looks like an accum
S&P 500 Daily Chart Analysis For Week of July 2, 2026Technical Analysis and Outlook:
In the abbreviated trading session last week, the S&P 500 Index posted a significant gain, reaching the Mean Resistance levels of 7,418 and 7,497. It is anticipated that the Index will continue to ascend toward a higher target, identified as Mean Resistance at 7,553, which has considerable potential to retest the completed Outer Index Rally at 7,610, and invoke Outer Index Rally extensions as identified on the chart.
On the downside, there is a considerable like
EUR/USD Daily Chart Analysis For Week of July 3, 2026Technical Analysis and Outlook:
In the previous week’s trading session, the Eurodollar exhibited a steady-to-higher upward movement, reaching a notable resistance level at 1.147. As a result, the Eurodollar has encountered a swift pullback.
Current market analysis indicates that the Eurodollar is likely to advance further, with the primary objective set at the Inner Currency Rally level of 1.149, via the Mean Resistance at 1.147.
However, currency traders must remain vigilant for the signific
Bitcoin(BTC/USD) Daily Chart Analysis For Week of July 3, 2026Technical Analysis and Outlook:
In the past week's trading session, Bitcoin has continued its upward trajectory after retesting the completed Inner Coin Dip at $58,500 and reaching the Mean Resistance at $61,800.
Currently, market analysis indicates a strong likelihood that Bitcoin will continue its ascent towards the Mean Resistance at $64,300, with the possibility of further progress reaching the upper target, the Key Resistance at $66,300.
Conversely, there is a risk that the cryptocurrenc
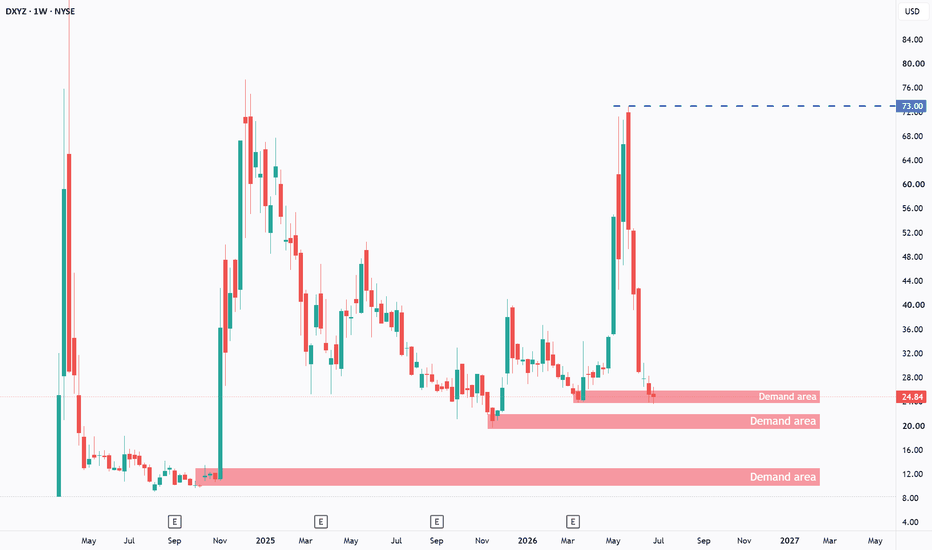
DXYZ - Trading Near NAV & Demand Zone in Focus!DXYZ is a closed-end fund (CEF) that provides public market exposure to a portfolio of high-growth private technology companies, including names such as SpaceX, OpenAI, and Anthropic. Unlike traditional ETFs, its market price can trade at a premium or discount to its Net Asset Value (NAV), which represents the estimated value of the fund's investments per share.
At the current price of around $24, DXYZ is trading around its latest reported NAV of $24.56 per share (as of March 31, 2026). In oth
$SYK — 200-Week EMA Test. 13% Below.NYSE:SYK is currently trading around $326 with the 200-week EMA sitting at approximately $320. Price has pulled 13.69% below its prior high and is now sitting 0.3x its weekly ATR above the 200-week EMA, which places it within the structural buy zone on the weekly chart.
The structural parallel worth noting
In 2022 to 2023, NYSE:SYK fell 13.10% below its 200-week EMA during a period of broader market pressure on healthcare. The DeMarker on the weekly reached deeply oversold levels. Price subs
$DBA — Six-Year Uptrend, EMA Pullback, Three Scale-Out TargetsAMEX:DBA , the Invesco DB Agriculture Fund, has been in a confirmed long-term uptrend since the 2020 pandemic low at $13.19. Current price $26.91. The 50-week EMA remains above the 200-week EMA at $24.45, confirming the long-term structural trend is intact.
The current technical condition
Price has pulled back from the 2025 high of $28.84 toward the 8 and 21 EMA cluster, which is currently providing weekly support in the $26.63 to $26.89 zone. The DeMarker on the weekly has been declining from
Will Global Supply Shocks Explode Cotton Prices?Cotton sits at a genuine inflection point, but the case for a durable bottom is more mixed than the headlines suggest. Prices have actually declined roughly 4% over the past month even as they ticked modestly higher into July, and the most recent independent analysis available called the bears still in control. The one unambiguous catalyst is policy, not speculation: India's textile ministry lifted its 11% cotton import duty from June 1 through October 30, the second such waiver in a year, givin
$VOO vs Active Management — What 25 Years of Data Actually ShowsThis is not a chart analysis piece. It is context that every market participant should understand before making decisions about how their capital is allocated.
S&P Dow Jones Indices' SPIVA Scorecard, which has tracked active fund manager performance against benchmark indices for 25 years, released its year-end 2025 data last month. 79% of all actively managed large-cap US equity funds underperformed the S&P 500 in 2025. Over 20 years, the figure is approximately 92%. Over 15 years, zero out of
$RKLB and $IRDM — The $8 Billion Deal Rocket Lab announced an $8 billion acquisition of Iridium Communications on Monday.
NASDAQ:RKLB rose nearly 16%, NASDAQ:IRDM rose over 25%. The deal structure pays Iridium shareholders $54 per share, half cash and half Rocket Lab stock, a 24.1% premium to the prior close. Expected close mid-2027 pending regulatory and shareholder approval.
The technical picture on NASDAQ:RKLB
The acquirer's stock rallying rather than falling on deal announcement is a notable signal. Watch how price beha
S&P 500 Daily Chart Analysis For Week of June 26, 2026Technical Analysis and Outlook:
In last week's abbreviated trading session, the S&P 500 Index experienced a substantial drop, completing Inner Index Dip 7,295. As a consequence, the cash market is experiencing an In-Force rebound to the Mean Resistance of 7,418, with a strong possibility of moving further to strike the Mean Resistance levels of 7,497 and 7,553, and a historical outcome of an Outer Index Rally at 7,611.
However, on the downside, there is a considerable chance of a continuous do