Long
Long
S&P 500 Daily Chart Analysis For Week of April 24, 2026Technical Analysis and Outlook:
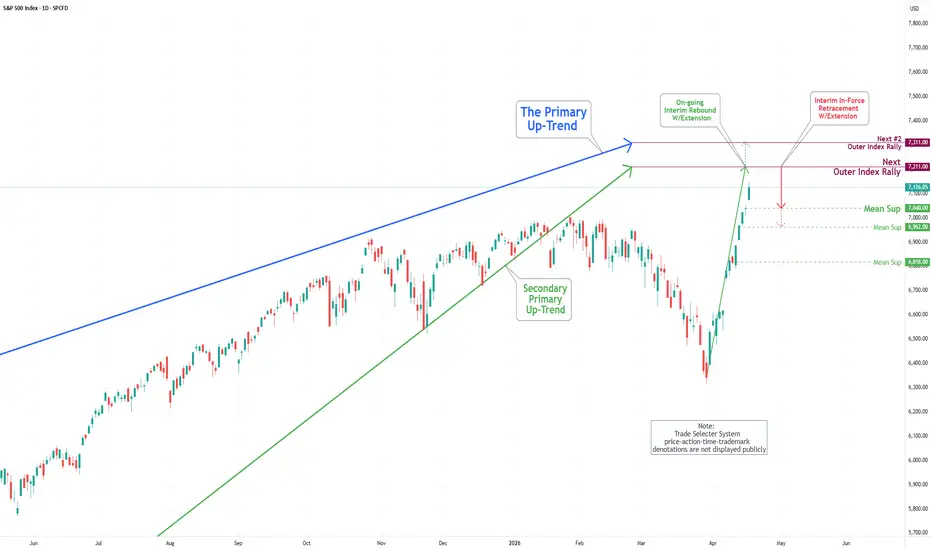
The S&P 500 Index has exhibited sustained upward momentum during this week's trading session, advancing notably after retesting the Mean Support level at 7,062.
Looking ahead to the upcoming trading session, the Index is projected to continue its ascent, with an expected target of 7,211 as part of the Next Outer Index Rally. Furthermore, it may potentially extend to a notable level of 7,311, indicative of the Next #2 Outer Index Rally.
In contrast, upon attaining the target of 7,211, a significant pullback to the Mean Support level of 7,062 is expected, with the possibility of a further decline to 6,962. Bitcoin(BTC/USD) Daily Chart Analysis For Week of April 24, 2026Technical Analysis and Outlook:
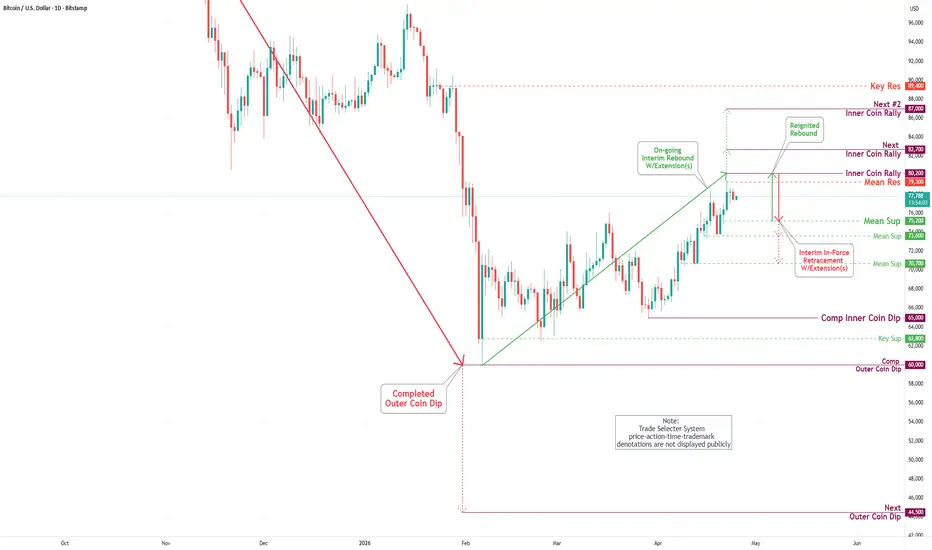
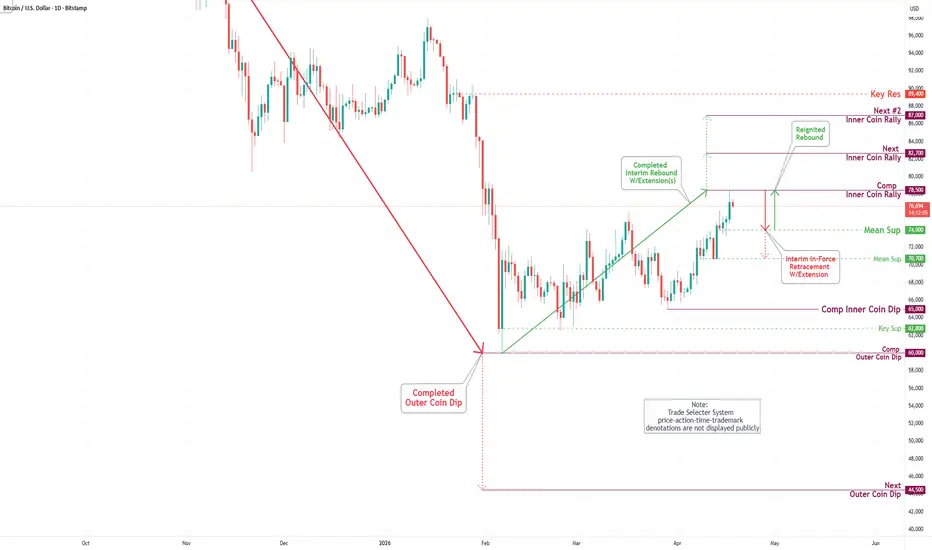
Bitcoin prices retested a crucial support level at $74,000 in this week's trading session and then surged strongly to the upside, retesting the Inner Coin rally at $78,500. Currently, the cryptocurrency is unfolding an upward move towards the extended target of $80,200, via a Key Resistance at $79,300.
Advanced market analysis indicates a continuous upward momentum towards the specified target. However, once this target is reached, we anticipate an interim retracement down to the identified Mean Support at $75,200, with additional potential support target levels at $73,600 and $70,700 to consider.
In light of all relevant factors, a notable rebound is expected to occur upon reaching the identified support levels. Why Did Wall Street Punish Northrop's Winning Quarter?Northrop Grumman's first-quarter 2026 results presented a striking paradox: the company delivered earnings per share of $6.14 against a consensus of $6.03, with revenue rising 4.4% year-over-year to $9.88 billion, yet the stock sold off nearly 7% on the release. Investors fixated on management's decision to reaffirm rather than raise full-year guidance, compounded by a $71 million Vulcan booster charge in Space Systems and first-quarter cash usage. Sentiment was further pressured by a proposed U.S.–Iran ceasefire, which rapidly unwound the "war premium" embedded in defense equities and rotated capital toward airlines and consumer technology. Even so, the company returned over 100% of its prior $3.3 billion free cash flow to shareholders through buybacks and a $2.31 quarterly dividend.
The bull case rests on what analysts describe as a "Deterrence Super-Cycle" anchored by a $95.7 billion backlog and multi-decade strategic programs. The B-21 Raider now accounts for roughly 10% of revenue, with a $4.5 billion government award and $2.5 billion in internal investment lifting production capacity by about 25% ahead of a 2027 in-service date; the Air Force has already purchased a test prototype to accelerate fielding. The LGM-35A Sentinel ICBM replacement remains under restructuring after a Nunn-McCurdy breach but is targeting a Milestone B decision in late 2026, while a $475 million modification to the Glide Phase Interceptor brings that program's value to $1.31 billion within the broader $151 billion SHIELD missile defense architecture. Consensus analyst price targets cluster near $693.60, with top estimates reaching $815.
Beyond legacy platforms, Northrop is positioning across emerging domains. Its Lumberjack and Talon IQ drones integrate with Palantir's Maven Smart System and swap autonomy software mid-flight, while the Cygnus XL spacecraft expanded ISS resupply payload by 33% on the NG-24 mission. International momentum includes an MOA with Hanwha Aerospace to co-develop the Advanced Reactive Strike (AReS) system and a contract to build Hungary's HUGEO sovereign communications satellite, plus expanded NATO logistics work worth nearly $596 million cumulatively. Deeper technology moats are forming in diamond-based RF microelectronics (five times copper's thermal conductivity), Reciprocal Quantum Logic architectures, solid-state LiDAR, and a patent portfolio of 11,109 filings with a 94.25% grant rate alongside Navy wins in SEWIP Block 3 electronic warfare, MK 54 MOD 2 torpedo integration, and E-130J TACAMO mission systems.
The principal risks are structural rather than cyclical: fixed-price contracts represent roughly half of sales and continue to absorb inflation, supply-chain, tariff, and skilled-labor pressures, with management targeting segment operating margins near 11.5%. The article's overall conclusion is that short-term de-escalation sentiment has obscured durable, multi-year demand visibility, and that the post-earnings decline represents a compelling entry point for investors willing to underwrite the deterrence thesis, though readers should weigh these claims against the genuine program-execution and margin risks involved, and treat this as analysis rather than personalized investment advice.  Long
Long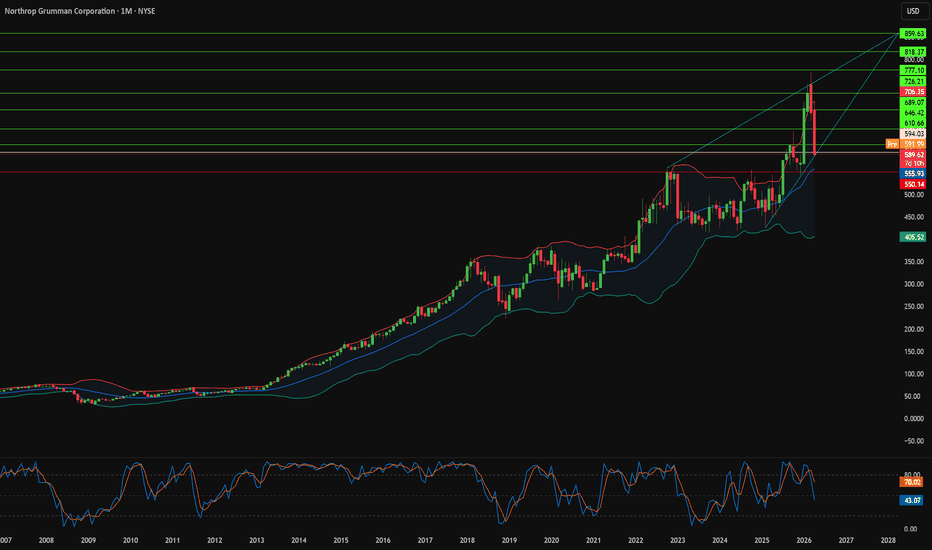
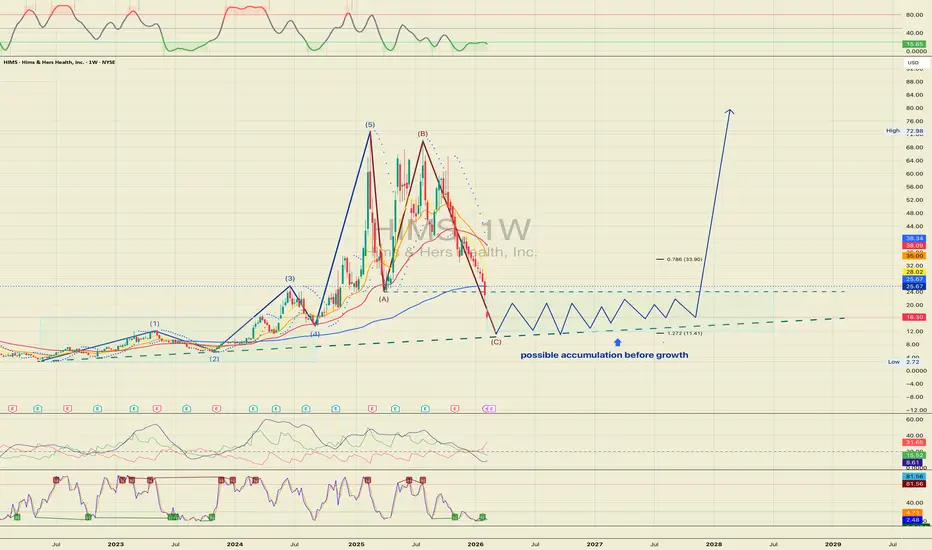
HIMS 1W: Subscription growth meets corrective mathHims & Hers Health operates a direct-to-consumer telehealth platform built on a recurring subscription model. The company scales digital consultations and pharmacy services, making it a high-beta growth stock sensitive to expansion and contraction cycles.
On the weekly chart, the prior impulsive move to 70+ has completed, and the market is developing an ABC corrective structure. Wave A declined toward 24, wave B retraced back toward 70, and wave C is currently unfolding.
Using a 1.272 projection of the AB move, the calculated completion zone for wave C is approximately 11.41. Current price at 16.30 indicates C remains in progress. The 11–12 region also aligns with the long-term rising diagonal support, strengthening the technical significance of that zone.
Indicators show momentum deceleration rather than reversal. ADX is declining, signaling weakening trend strength. DI− remains dominant but without acceleration. RSI is approaching oversold territory, and Stochastic is positioned in the lower range. This reflects exhaustion of downside impulse, not confirmed accumulation.
The structural focus is clear: potential completion of wave C near 11–12. Confirmation requires a local higher low and a recovery above 25–26 to shift structure back into expansion.
Before growth resumes, markets often reset excess.
S&P 500 Daily Chart Analysis For Week of April 17, 2026Technical Analysis and Outlook:
The S&P 500 Index has continued to rise with incredible vengeance this week, retesting and surpassing the completed Inner Index Rally 6,840, nullifying the Key Resistance level of 6,977, completing the Outer Index Rally 7,026, and the Next Outer Index Rally 7,110 in one big sweep.
Looking ahead to the forthcoming trading session, the S&P 500 Index is anticipated to rise to a steady-to-higher level by completing the Next Outer Index Rally 7,211 and possibly extending to an astonishing level of the Next #2 Outer Index Rally 7,311.
Contrariwise, should the index sustain its upward momentum and complete the Next Outer Index Rally to 7,211, expectation is for a severe pullback to Mean Support 7,040, with the possibility of extending to Mean Support 6,962. Bitcoin(BTC/USD) Daily Chart Analysis For Week of April 17, 2026Technical Analysis and Outlook:
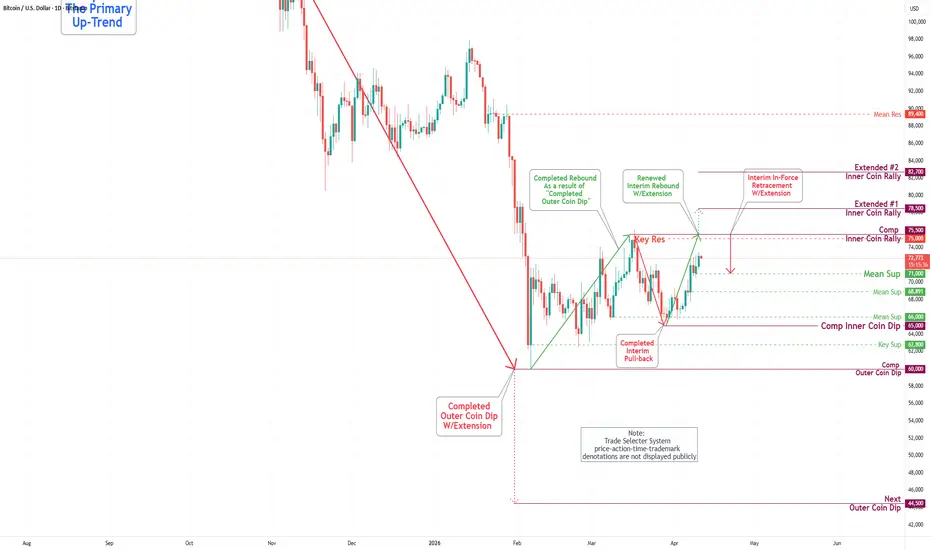
Bitcoin prices retested and broke out of the completed Inner Coin Rally at 75,500 and Key Resistance levels of 75,000, and completed the Extended #1 Inner Coin Rally at 78,500.
Progressive market analysis suggests strong potential for an Interim in-Force Pullback to Mean Support 74,000, with a possible extension to Mean Support 70,700.
When all is said and done, a hefty rebound from Mean Support at 74,000 and/or 70,700 will likely be initiated after achieving the initial price-down targets. JPMorgan Chase (JPM)—Scale, Branch Expansion, and NII DurabilityJPMorgan NYSE:JPM is the premier U.S. universal bank spanning consumer banking, investment banking, markets, wealth/asset management, and payments—built to compound through cycles via scale and diversification.
Key Catalysts
Retail footprint expansion (2026): JPMorgan plans to open 160+ new branches across 30+ states and renovate ~600 locations in 2026—strengthening deposits, lending, and local market share in fast-growth regions.
Resilient earnings power: In its 2025 Annual Report, JPMorgan reported $182.447B total net revenue and $57.048B net income—elite profitability supported by its diversified engine.
Net interest income remains a core driver: 2026 firmwide NII guidance has been discussed in the ~$103B–$104.5B range (including markets), reinforcing that the balance sheet can still generate large recurring income even as the rate cycle evolves.
Investment Outlook
Bullish above: $255–$260
Upside target: $380–$390 — supported by branch-led deposit growth, durable NII, and best-in-class profitability/scale.  Long
Long
Spire Global (SPIR) — High-Margin Pivot + RF Intelligence UpsideSpire Global NYSE:SPIR operates a large LEO satellite constellation delivering real-time data across aviation, weather, and RF intelligence—a direct play on the expanding space-based analytics and sovereign intelligence markets.
Key Catalysts
Strategic Shift to Higher-Margin Data Services: Post divestiture of the maritime business, Spire is streamlining to focus on scalable intelligence products with stronger margins and cleaner execution.
Core Revenue Acceleration: +44% YoY growth (ex-maritime) with management outlook for 50%+ growth in 2026, driven by expanding demand across government, aviation tracking, and climate intelligence.
RF Geolocation as the Breakout Engine: Plans to expand RF capacity up to 15x, enabling more real-time global tracking—opening larger opportunities in defense, sovereign security, and RF monitoring.
Operating Leverage Potential: A tighter product focus + higher-margin data mix increases the probability of margin expansion as satellite capacity scales.
Investment Outlook
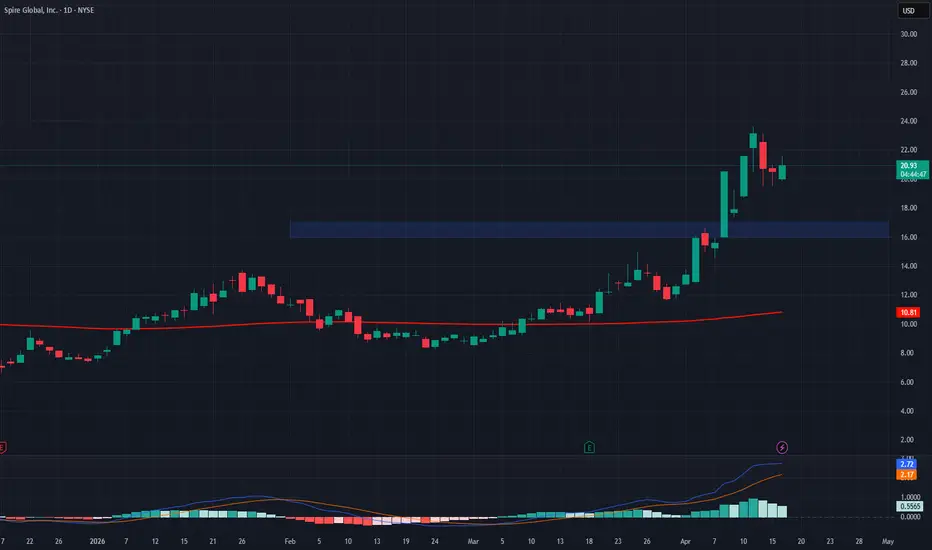
✅ Bullish above: $16–$17
🎯 Upside target: $28–$29, supported by accelerating core growth, RF scale-up, and a higher-margin revenue mix.  Long
Long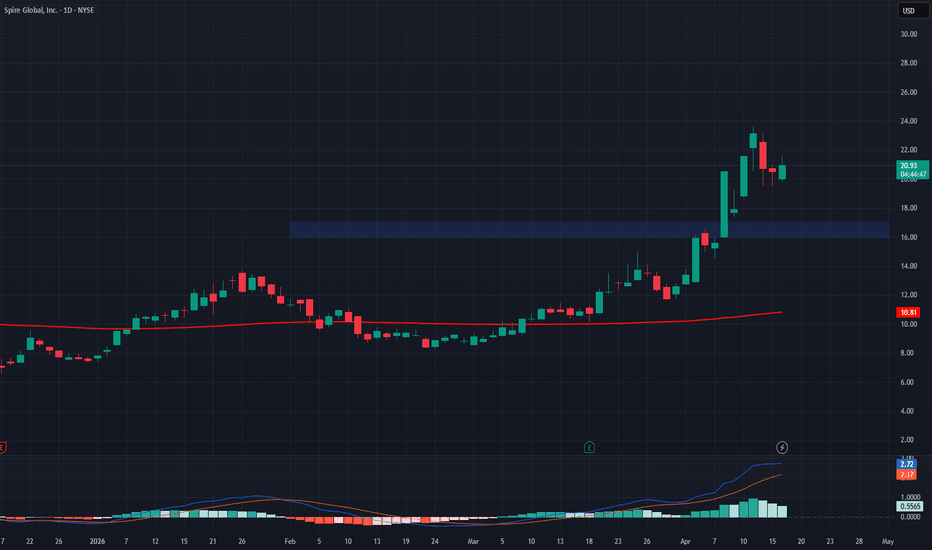
 Long
Long
RUSSELL 2000: THE SMALL-CAP RECKONINGFrom tariff shockwaves and a $368 billion debt wall to AI reshoring and a patent gold rush, what really drives America's small-cap benchmark.
KEY STATS AT A GLANCE
• –22% Bear Market Low, April 2025
• +12% Q1 2026 Surge
• 18× Forward P/E (vs. S&P 500 at 22×)
• $368B 2026 Small-Cap Debt Maturity Wall
The Russell 2000 has never been a quiet index. But the twelve months spanning April 2025 through April 2026 delivered a volatility sequence so compressed, so multi-causal, and so revealing of structural fault lines that it demands a full forensic accounting. Within a single calendar year, the index entered a bear market, staged a record rebound, flirted with all-time highs, and then corrected sharply, all while the S&P 500 climbed in relative calm. Understanding why requires examining forces far beyond price charts.
This analysis cuts across twelve interconnected domains: geopolitics, geostrategy, industry structure, company culture, business models, management quality, macroeconomics, monetary policy, technology, cybersecurity, science, and patents. Each domain contributed to Russell's turbulence. Together, they reveal the index as a high-sensitivity instrument not merely of small-cap fortunes, but of the entire American economic operating system.
Tariff Shockwaves and the Liberation Day Reckoning
On April 3, 2025, the Russell 2000 plunged 6.6% in a single session, the first major U.S. benchmark to enter bear market territory that cycle. The trigger: the Trump administration's "Liberation Day" sweeping reciprocal tariff rollout. Analysts initially expected small-caps to benefit from protectionist policy, given their domestic revenue orientation. They were wrong.
The catch lay in supply chains. Companies like Victoria's Secret and Urban Outfitters — both Russell 2000 constituents source heavily from abroad. Tariff-driven input cost inflation hit their margins immediately. The index fell nearly 22% from its 52-week high, erasing a post-election surge that had reached 8.6% in a single week after November 2024.
"The revival in small caps expected from the America First agenda turned into a rout for companies whose fortunes are most closely tied to the U.S. economy." Bloomberg, April 3, 2025
By late 2025, however, a "shock and bore" stabilization in trade negotiations shifted the narrative. Tariffs that initially caused panic ultimately incentivized reshoring, the relocation of manufacturing back to American soil. Small-caps, generating roughly 77% of revenues domestically, became the structural winners of that pivot.
Reshoring, the Middle East, and the Domestic Fortress
Geostrategy operates on longer timelines than geopolitics, and its fingerprints on the Russell 2000 are correspondingly deeper. The reshoring movement, accelerated by both tariff policy and pandemic-era supply chain trauma, created a structural tailwind for small-cap industrials, construction firms, and logistics operators that cannot be reversed quickly.
The Middle Eastern conflict simultaneously acted as an unexpected catalyst. Global supply chain disruptions, which battered multinationals dependent on foreign logistics, largely bypassed the domestically anchored Russell 2000 constituents. Companies like Bloom Energy gained relative insulation precisely because their revenue base never left American borders. On March 23, 2026, peace-talk announcements triggered a 10.5% intraday drop in crude oil prices, sparking a 3% single-session surge in the Russell, its largest in over six months.
Near-shoring initiatives, supported by fiscal legislation, reinforced this geostrategic advantage. Infrastructure spending directed at domestic capacity ports, semiconductors, and clean energy disproportionately benefited smaller, regionally focused companies over the mega-cap multinationals that dominate the S&P 500.
The K-Shaped Recovery Within Small Caps
Not all sectors within the Russell 2000 participated equally in the recovery. Biotechnology, industrials, and regional banking led the rebound. Biotech benefited from a pharmaceutical patent cliff that drove large-cap acquirers to hunt for small-cap innovators. Industrial firms rode the reshoring wave. Regional banks, long suppressed by compressed net interest margins, recovered as the yield curve normalized.
On the losing side, debt-laden "zombie" firms, operationally unviable companies that survived only through near-zero interest rates, faced existential pressure. Companies like Atara Biotherapeutics and Aquestive Therapeutics struggled to participate in the rally as investors demanded cash flow positivity, not just revenue growth. The "quality divide" between profitable small-caps and speculative names became the defining investment theme of 2026.
Optical retail and material handling sectors also underperformed. National Vision closed stores and reported operating margins below industry averages. Columbus McKinnon saw flat sales over two years while expenses climbed. These divergences confirm that sector selection within the Russell 2000 carries far more alpha than index-level positioning alone.
Culture as Competitive Moat
In a year defined by margin pressure and debt refinancing anxiety, company culture emerged as an underappreciated differentiator. Small firms with strong innovation cultures and disciplined capital allocation consistently outperformed those that prioritized growth at any cost. Construction Partners, a civil infrastructure firm within the Russell 2000, exemplified this dynamic: organic revenue growth remained steady, but earnings-per-share growth dramatically outpaced revenue, reflecting operational leverage and cultural discipline around cost management.
Analysts increasingly scrutinize leadership communication quality, employee retention metrics, and R&D-to-revenue ratios as leading indicators for small-cap performance. Companies that built cultures of accountability and execution during the high-rate environment emerged stronger. Those that burned capital on undisciplined expansion now face refinancing walls they cannot scale.
Recurring Revenue vs. the Refinancing Wall
The Federal Reserve's prolonged high-rate cycle exposed a lethal vulnerability in the Russell 2000: floating-rate debt. Nearly 40% of Russell 2000 constituents carry floating-rate obligations. When the federal funds rate held near 5.25–5.50%, this cohort faced a compounding capital cost crisis. The $368 billion debt maturity wall arriving in 2026 forced thousands of firms to refinance at rates near 6.5% compared to the 1–2% rates they had locked in during the pandemic era.
Business models built on subscription revenues, long-term contracts, and asset-light operations proved far more resilient. SaaS-adjacent small-caps, specialty insurers with recurring premiums, and infrastructure firms with contracted cash flows traded at significant premiums to peers with transactional or project-based revenue. The market effectively priced business model quality into valuations with unusual precision throughout this cycle.
Goldman Sachs analyst Ben Snider noted that return dispersion within the Russell 2000 exceeds twice that of the S&P 500, making it fertile ground for active alpha generation. The bank projects that changes in fiscal policy, AI adoption, and M&A activity will create unusually large idiosyncratic returns in 2026. This dispersion rewards deep, stock-level research over passive index exposure, a structural argument for active small-cap management at this moment in the cycle.
The CEO Premium in a Turbulent Market
Leadership quality carries an outsized price premium in small-cap markets, where a single executive decision can move the needle materially on a $500 million company. The 2025–2026 cycle validated this asymmetry. Firms led by CEOs who communicated clearly during the tariff shock, maintained liquidity discipline, and articulated credible refinancing strategies retained investor confidence during drawdowns.
Conversely, executives who over-leveraged during the zero-rate era and failed to hedge interest rate exposure destroyed significant shareholder value. The "One Big Beautiful Bill Act" (OBBBA), effective January 1, 2026, introduced 100% bonus depreciation and immediate R&D expensing provisions that reward capital-allocation-savvy leaders who moved quickly to capture the tax incentives. Firms with management teams that had studied and prepared for the OBBBA provisions captured first-mover advantages in fixed asset deployment.
The Fed's Pivot and the Rate Sensitivity Problem
No single variable moved the Russell 2000 more consistently than Federal Reserve policy. The index's disproportionate sensitivity to rate changes driven by that floating-rate debt concentration made it a leveraged proxy for monetary policy expectations. Three consecutive 25-basis-point cuts in late 2025, bringing the federal funds rate to 3.50–3.75%, acted as a financial relief valve for the index's most indebted constituents.
Historical data reinforces this pattern starkly. The Russell 2000 has averaged 36% returns in the 12 months following the final rate cut of a tightening cycle since 1984. The 2025–2026 cycle tracked this pattern closely, with the index posting approximately 12.8% for full-year 2025, modest by historical standards, but with substantial momentum building through Q4. Early 2026 extended that momentum before the March correction.
The "soft landing" macro backdrop, with real GDP growth projected at 2.6% for 2026, inflation gradually normalizing, provides the ideal operating environment for small-cap earnings expansion. Consensus estimates forecast 17–22% EPS growth for Russell 2000 constituents in 2026, more than doubling the 14% projected for the S&P 500.
Valuation Gaps and the Mean-Reversion Case
By late 2025, the valuation gap between the Russell 2000 and the S&P 500 reached a 30-year extreme. Small-caps traded at roughly 16× forward earnings versus 22–23× for large-caps. This historically anomalous discount created what analysts at Goldman Sachs called "upside risk," a compression trade waiting for a catalyst. The Fed's rate cuts provided that catalyst.
As of January 2026, the Russell 2000's forward P/E had expanded to 18.11×, still below the S&P 500 but meaningfully re-rated. This valuation normalization, combined with the EPS growth inflection, creates a dual engine for returns: multiple expansion plus earnings growth. The "Magnificent Seven" mega-caps, by contrast, face the reverse dynamic, rich valuations meeting decelerating AI capital returns.
Consumer resilience underpins the domestic revenue base. Models project consumption growth exceeding 2% year-over-year through 2026. For a Russell 2000 cohort deriving 77% of revenues from U.S. consumers and businesses, this baseline spending strength provides a floor that international-facing multinationals simply cannot claim.
AI as Tailwind, Not Headwind, for Small Caps
The dominant narrative of 2024–2025 framed artificial intelligence as exclusively beneficial to mega-cap technology firms. The reality arriving in 2026 is more nuanced. Large-cap AI leaders now grapple with "AI fatigue," exhausted valuations, massive capital expenditure commitments, and uncertain monetization timelines. Meanwhile, small-cap industrials and specialty manufacturers use AI-driven operational tools as pure cost reduction and margin expansion levers.
Corporate AI adoption within the Russell 2000 accelerated dramatically through 2025. Manufacturers deploying predictive maintenance algorithms cut downtime costs. Regional logistics firms using route optimization AI improved fuel efficiency. Healthcare companies leveraging AI-assisted diagnostics have reduced administrative overhead. For these firms, AI is not a product; it is a productivity multiplier applied to existing businesses, generating immediate returns without the capital intensity of foundation model development.
The OBBBA's immediate R&D expensing provision incentivized this AI integration wave further. Small-cap firms that previously deferred technology investments now accelerate them, creating a technology adoption gap between the Russell 2000 innovators and laggards that will compound into earnings divergence over the next three years.
The Hidden Risk Premium in Small-Cap Security
Cybersecurity represents one of the most underappreciated risk factors embedded in Russell 2000 valuations. Small and mid-sized companies are disproportionately targeted by ransomware and supply chain attacks, yet spend a fraction of what large-caps allocate to security infrastructure. The gap is not trivial: a material cyberattack can erase 15–30% of a small-cap's market capitalization in days, with recovery timelines measured in quarters, not weeks.
Investors who incorporate cybersecurity posture into fundamental analysis gain a risk-adjusted edge. Companies with SOC 2 Type II certification, active incident response plans, and cyber insurance appropriate to their revenue profiles demonstrate operational maturity that correlates with broader management quality. Conversely, firms that treat security as a compliance checkbox rather than a strategic priority carry hidden liability that standard financial metrics fail to capture.
The reshoring trend creates a second cybersecurity dynamic: as more manufacturing and critical infrastructure relocate to U.S. soil, the attack surface for state-sponsored threat actors expands. Small-cap industrials operating in defense-adjacent sectors face nation-state adversaries for the first time, a threat vector their IT teams were never designed to confront.
Biotech, Clean Energy, and the Innovation Pipeline
The Russell 2000's biotech and clean energy cohorts represent its highest-variance, highest-potential segment. Biotech small-caps occupy a unique position: they carry the risk of binary clinical outcomes but benefit from a structural acquisition pipeline driven by large-cap pharmaceutical companies facing patent expirations. The "patent cliff" facing major pharma firms with blockbuster drugs losing exclusivity through 2027 has created M&A urgency that provides a consistent floor under small-cap biotech valuations.
Clean energy small-caps solar installers, battery storage manufacturers, and grid modernization specialists benefit from dual tailwinds: energy security concerns driving domestic infrastructure investment, and the OBBBA's capital expensing provisions accelerating equipment deployment. Companies with defensible technology positions in these sectors attracted strategic acquirers and institutional capital throughout 2025.
High-tech manufacturing small-caps occupy an emerging niche at the intersection of reshoring and advanced fabrication. Defense contractors, precision component manufacturers, and specialized semiconductor suppliers found demand surging as supply chain diversification policies took hold. These firms represent the most durable long-term growth thesis within the Russell 2000 businesses with genuine technological differentiation, domestic manufacturing footprints, and government contract visibility.
Intellectual Property as a Valuation Driver
Patent portfolios have become an increasingly decisive valuation factor for Russell 2000 constituents, particularly in biotech, medtech, and specialty industrial sectors. The large-cap pharmaceutical patent cliff does not merely create M&A demand; it defines acquisition premiums. A small-cap biotech with a clean, well-prosecuted patent estate in a therapeutic area facing large-cap competition commands valuations 30–50% above peers with equivalent revenue but weaker IP defensibility.
Investors now conduct IP due diligence as a standard pre-investment exercise, analyzing patent breadth, claim strength, expiration timelines, and Freedom-to-Operate (FTO) clearances. Companies with continuation patent strategies filing sequential improvements that extend IP protection cycles attract sustained institutional interest. Those with single foundational patents expiring within three years face a different investor calculus entirely.
The OBBBA's immediate R&D expensing provision has the secondary effect of accelerating patent filing activity across the Russell 2000. When companies expense R&D immediately rather than amortizing it, the cash flow benefit incentivizes reinvestment into new IP development. The patent pipeline filling now will shape competitive dynamics and M&A valuations through 2029 and beyond.
"Dispersion within the Russell 2000 indicates particularly fertile ground for alpha generation the index's return dispersion is more than twice that of the S&P 500." Goldman Sachs, Ben Snider, December 2025
What the Russell 2000 Tells Us About America
The Russell 2000's turbulence across 2025–2026 is not noise. It is a signal of a high-resolution readout of the American economy's stress points and growth vectors simultaneously. Tariff policy, rate sensitivity, technology adoption curves, IP development cycles, and geopolitical reshoring all converge in a 2,000-stock universe that captures Main Street America more faithfully than any large-cap index.
The index faces genuine near-term risks: the $368 billion refinancing wall, stubborn inflation in select input categories, and geopolitical re-escalation that could reverse energy price relief. But the structural tailwinds valuation discount versus large-caps, domestic revenue insulation, OBBBA fiscal stimulus, AI-driven productivity gains, and the biotech M&A pipeline represent the strongest fundamental case for small-cap outperformance in a generation.
The quality divide will intensify. Profitable, cash-flow-positive, IP-rich, and well-managed small-caps will diverge from zombie firms at an accelerating rate. Active management and rigorous fundamental analysis spanning geopolitics, technology posture, patent estates, and management quality will separate exceptional returns from index exposure.
For investors willing to do the work, the Russell 2000 in 2026 is not just an index. It is an opportunity set.
 Long
Long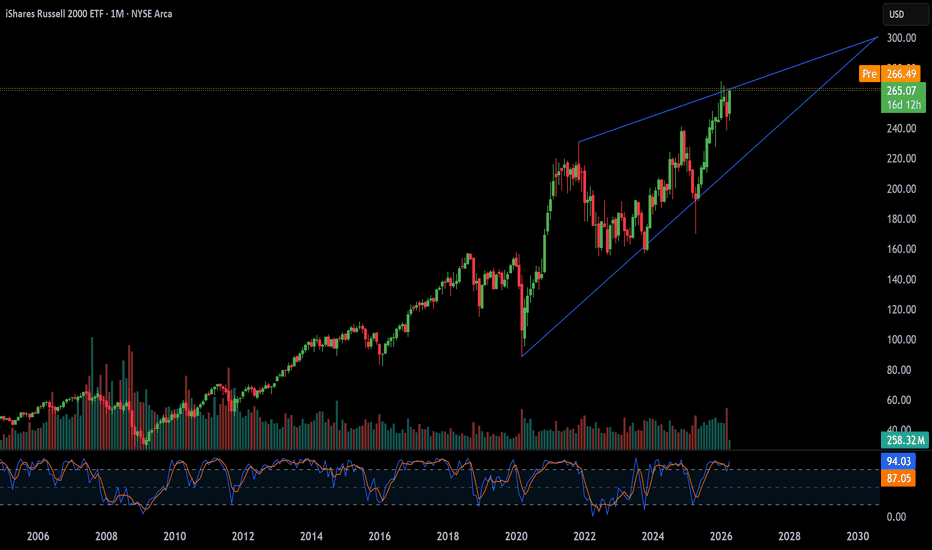
USD/HUF: Hungary's Political Reset Reshapes the ForintA historic electoral landslide, €17 billion in frozen EU funds, and a high-tech battery revolution converge to redraw Hungary's currency trajectory and challenge long-held assumptions about emerging-market FX risk.
The Seismic Shift: A 16-Year Regime Ends
On April 12, 2026, Hungary rewrote its political playbook entirely. Péter Magyar's centre-right Tisza party secured 138 of 199 parliamentary seats, a supermajority that ended Viktor Orbán's 16-year grip on power. Voter turnout reached nearly 80%, the highest mandate in post-socialist Hungarian history. Currency markets responded instantly. The EUR/HUF rate broke below 370 before Monday's market open, reaching 366.64, its lowest level since April 2022. The forint's 4% appreciation in a matter of days ranks among its sharpest short-term rallies in years.
Geopolitics and Geostrategic Realignment
Orbán's government had tilted Hungary toward Moscow, maintaining cozy energy ties with Russia and obstructing EU consensus on Ukraine policy. Magyar's election signals a full geostrategic reversal. He has pledged to restore democratic checks, embrace Brussels, and help Ukraine diplomatically. Markets treat this as a direct reduction in the political risk premium embedded in the forint for years. RBC Global Asset Management's senior EM strategist, Timothy Ash, captured it clearly: "The market is reacting to uncertainty dissipating, and renewed optimism for policy changes that should align Europe." FX traders and not just macro funds now price Hungary as a lower-risk CEE asset.
"Magyar will need better relations with the EU. There are lots of structural funds that will probably get released, and the market knows the economic policy team well."
— Timothy Ash, Senior EM Strategist, RBC Global Asset Management
The €17 Billion Catalyst: EU Funds Unlocked
The European Commission froze approximately €17 billion in cohesion and recovery funds for Hungary in late 2022 over rule-of-law concerns. Magyar's government must meet a hard August 2026 deadline to reclaim them. This potential inflow dwarfs normal carry-trade dynamics. Goldman Sachs pre-election analysis compared the setup to Poland's 2023 election, flagging the EUR/HUF downside of 4–5% on a benign outcome, a forecast that has now substantially materialized. Critically, potential EU fund disbursements include low-cost defence and infrastructure loans. These inflows strengthen Hungary's external position and reduce its current-account vulnerability, a factor that directly supports USD/HUF bears.
Macroeconomics: Growth, Inflation, and the Rate Path
The National Bank of Hungary (NBH) cut its benchmark rate by 25 basis points to 6.25% in February 2026, its first cut in 18 months. GDP growth is forecast to accelerate from 0.5% in 2025 to 2.3–2.4% in 2026, supported by fiscal stimulus and recovering consumption. The EU Commission projects GDP expanding further to 2.1% in 2027. Headline inflation fell to 2.1% year-on-year in February, its lowest in five years. The NBH projects an average of 3.2% inflation in 2026, converging toward its 3% target by late 2027. At 6.25%, Hungary's rate still towers above Poland's 3.75%, preserving the carry-trade appeal that has driven forint strength throughout 2025 and into 2026.
Carry Trade Dynamics: The Forint as CEE's Star
Hungary's real interest rate remains the highest in the CEE3 region, along with the Czech Republic, Hungary, and Poland. ING analysts describe the forint as "the main carry star within CEE3" heading into mid-2026. A strong forint also helps the NBH's own objectives: it reduces imported inflation, eases service price pressure, and lowers the burden of FX-denominated public debt, which exceeds 30% of total government debt. However, Ash warned that eventual rate normalization toward Polish levels implies significant rate cuts ahead. That prospect introduces a future headwind for USD/HUF bears; rate cuts will narrow the differential that currently anchors carry flows.
Management and Leadership: The Kármán Factor
Investors rarely react to ministerial appointments with the conviction they showed after András Kármán's expected nomination as Hungary's next Finance Minister. Kármán, Tisza's economic advisor, previously served on the board of the European Bank for Reconstruction and Development (EBRD). His technocratic profile signals a clean break from the Orbán government's interventionist model, one marked by windfall taxes on banks, energy firms, and retailers. Tisza's two-thirds majority gives it the legislative power to rapidly dismantle these sector-specific levies. OTP Bank, MOL, Richter, and Magyar Telekom all surged 2–5% on Monday, pricing in exactly this structural change. Leadership credibility, in this case, moved markets as decisively as the electoral result itself.
Industry Trends: Hungary's Battery Belt
Hungary has built a formidable position as Europe's EV battery manufacturing hub, and this industrial identity shapes long-run FDI flows into HUF-denominated assets. Samsung SDI's Göd facility represents just the anchor. A €2.37 billion expansion is underway to quadruple capacity with 12 new production lines, backed by a long-term prismatic cell supply agreement with Hyundai Motor running through 2032. South Korean companies alone have invested over 5,000 billion forints into Hungary over the past decade, creating nearly 20,000 jobs. CATL and BYD also operate facilities on Hungarian soil. These multi-year capital commitments mean sustained foreign currency inflows, a structural tailwind for the forint, irrespective of election outcomes.
Technology and High-Tech: R&D Patents and Innovation Clusters
The battery sector drives not just manufacturing FDI but also high-value R&D activity. Samsung SDI inaugurated one of only five global R&D centres at Göd in June 2025, investing €61.9 million and creating 25 specialist roles. The facility focuses on next-generation cell chemistry, manufacturing process optimization, and lithium-ion safety technology areas, generating significant intellectual property. Hungary's strategic positioning within EU innovation funding frameworks positions it to attract further patent-generating investment under Magyar's government. The transition from an "illiberal state" characterization toward a rules-based EU partner directly impacts FDI risk assessments by global tech and pharma multinationals, which integrate governance scores into location decisions.
Business Models Under Reform: Windfall Tax Removal
Orbán's sector-specific windfall taxes represented a distortion that depressed valuations across Hungary's corporate landscape. Banks paid extraordinary levies; energy companies faced unpredictable margin caps; retailers operated under price controls. Tisza's supermajority gives it unambiguous authority to repeal these measures swiftly. The immediate consequence is a re-rating of Budapest-listed equities, a 3%+ rise in the BUX index to a record 136,000 points on the day after the election confirms this. A more predictable, rules-based tax environment reframes Hungary's attractiveness to institutional capital. Private equity, strategic acquirers, and sovereign wealth funds have consistently cited Orbán-era fiscal unpredictability as a deterrent. That deterrent lifts.
Cybersecurity, Digital Governance, and Investor Confidence
Hungary under Orbán attracted criticism for deploying Pegasus spyware against journalists and opposition figures' allegations that directly fed into sovereign risk assessments by global institutional investors. Cybersecurity governance forms a measurable component of ESG risk frameworks; funds applying these screens had penalized Hungarian assets with an additional discount. Magyar's pledges to restore judicial independence and dismantle the illiberal state architecture address these concerns structurally. A cleaner digital governance record improves Hungary's standing in ESG-weighted portfolios, which increasingly determine capital allocation across emerging and frontier markets. This is not a soft factor; it influences the risk-adjusted return that anchors long-term currency flows.
The Dollar Variable: Fed Policy and USD/HUF Direction
USD/HUF does not trade in a vacuum. The US dollar's own trajectory interacts with forint dynamics. The Fed's rate path, global risk appetite, and energy price shocks all shape the dollar side of the pair. ING analysts model an Iran war scenario with a 30% probability in which energy prices spike and the ECB raises rates, compelling the NBH to follow suit. Under that scenario, the forint would require additional support, and USD/HUF could reverse sharply. Conversely, if global energy conditions normalize by summer, the NBH's base case allows for further rate cuts in Q3 2026, potentially compressing the rate differential but within a context of improving macro fundamentals that sustain forint demand.
Risk Balance: Bull and Bear Cases
Forint bull case (HUF strengthens)
* €17bn EU fund disbursement by Aug 2026
* Windfall tax removal re-rates equities
* FDI acceleration under stable governance
* Battery sector investment deepens
* Continued high real rates vs CEE peers
Forint bear case (HUF weakens)
* Iran war prolongs energy price shock
* Delayed or partial EU fund release
* Aggressive NBH rate-cutting cycle
* EV demand slowdown hits battery FDI
* Dollar strength from Fed policy hawkishness
Outlook: Structural Reset or Temporary Euphoria?
The immediate market verdict is emphatic: the forint's strongest four-year high against the euro, a record Budapest bourse, and analyst upgrades from Goldman Sachs, Commerzbank, Danske Bank, and MUFG all point in the same direction. The structural argument rests on three pillars: EU fund reintegration, governance reform, and industrial FDI depth. If Magyar's government executes effectively, the political risk premium that inflated USD/HUF for years unwinds progressively. Gábor Bukta, head of analysis at Concorde, cautions that "the coming months will determine whether this marks a durable new equilibrium or merely a strong but temporary rally." Watching the August EU funds deadline, the NBH's next rate decision, and Kármán's first budget moves will answer that question definitively. S&P 500 Daily Chart Analysis For Week of April 10, 2026Technical Analysis and Outlook:
The S&P 500 Index has once again demonstrated a significant price increase during this week's trading session, exceeding the Mean Resistance levels of 6,605 and 6,718. This robust advance led to the completion of the Inner Index Rally at 6,840.
Looking ahead to the forthcoming trading session, the S&P 500 Index is anticipated to undergo a steady-to-lower pullback, with a potential interim retracement toward the Mean Support level of 6,705. Furthermore, there exists a possible downside target at the Mean Support level of 6,582 before resuming an upward trend.
Conversely, should the index sustain its upward momentum, it could progress to the Outer Index Rally target of 7,026 through the Key Resistance level of 6,977, and prospectively reach the subsequent Outer Index Rally at 7,110. Bitcoin(BTC/USD) Daily Chart Analysis For Week of April 10, 2026Technical Analysis and Outlook:
Recently, Bitcoin prices broke out of the Active Inner Trading Zone, moving past the Mean Resistance levels of 68,900 and 71,200. The focus is now on Key Resistance at 74,900, with a potential retest of the Inner Coin Rally at 75,500.
Advanced market analysis indicates a potential for further price increases, reaching the extended #1 Inner Coin Rally at 78,500, and ultimately progressing to the critical extended #2 Inner Coin Rally at 82,700.
Conversely, there is potential for a gradual decline toward the Mean Support level at 71,000 before any upward movement toward the initial targets will take place However, should market conditions deteriorate, resulting in a decline to the Mean Support at 71,000, an Interim In-Force Retracement will be initiated after achieving the initial price targets or from the extended #1 Inner Coin Rally at 78,500 or the extended #2 Inner Coin Rally at 82,700. Render: ready for the next leg? key levels and targets aheadRender, ready for the next leg or due a cooldown? Lately AI and GPU narratives are heating up again, and according to market chatter Render keeps popping up whenever traders talk “AI season 2.” Today price pulled back after a strong spike, but buyers stepped in fast, which tells me the dip is being hunted, not feared.
On the 4H chart price bounced off that 1.84 support block with solid reaction, while RSI cooled from overbought and curved back up above 60. Structure is still higher highs and higher lows, so for now I lean bullish, watching for continuation toward the recent wick highs around 2.20 and potentially the upper green zone. If AI headlines stay positive, I expect fresh FOMO buyers to join any clean breakout.
My base plan: as long as 1.84 holds, I treat dips into that zone as potential reloads with a target around 2.20 then 2.30+. If price nukes below 1.84 and closes under it on 4H, I step aside and look for a deeper sweep toward 1.77 or even the lower green demand. I might be wrong, but for now the trend is up and I’m trading with it, not against it. ✅ FDP — Vertical Scale + Higher-Margin Brand ExpansionFresh Del Monte Produce NYSE:FDP is a vertically integrated producer and distributor of fresh and prepared fruits/vegetables, offering direct exposure to global food demand and the long-term shift toward healthier eating.
Key Catalysts
Transformational Brand Unification: The ~$285M acquisition of Del Monte Foods assets expands FDP into higher-margin packaged/ready-to-eat categories—unlocking synergies, cross-selling, and stronger brand leverage across channels.
Margin & Cash Flow Recovery: Operational execution is improving, with $245M operating cash flow in 2025 and reduced debt, supported by portfolio streamlining and a tighter focus on core segments.
Health & Convenience Tailwinds: FDP is positioned at the intersection of fresh produce leadership and growing demand for ready-to-eat + packaged offerings—supporting better pricing power, mix, and distribution reach.
Why It Matters
✅ Vertical integration supports supply control and consistency
✅ Packaged expansion lifts margin profile and reduces pure commodity exposure
✅ Strong cash flow enables reinvestment + balance sheet strength
Investment Outlook
Bullish above: $34–$35
Upside target: $56–$58, supported by brand-driven mix shift, improving cash generation, and healthier-eating demand trends.  Long
Long
Cosmos: is ATOM ready to surprise? key levels for todayCosmos
Who’s still watching ATOM while everyone chases the shiny new narratives? Lately the ecosystem has been under pressure as funding and governance talks keep popping up, and according to industry sources sentiment is still pretty cautious. Today price is stuck in a boring range, but ranges are where the next big asymmetric move usually loads.
On the 4H chart, ATOMUSDT is sitting just above that green demand box around 1.63‑1.66 with RSI hovering near neutral, so sellers are slowing but buyers aren’t in full control yet. VPVR shows the main volume node right around 1.70, and we keep getting rejected from the red supply zone overhead, so I’m leaning short term long from support back into that 1.72‑1.78 pocket. If fresh positive headlines hit the sector, this tight base can turn into a squeeze pretty fast.
My game plan: ✅ Look for a dip into the green zone to build a starter long, targeting the 1.75‑1.85 resistance band. Invalidated for me if we close below 1.60, which opens the door to a deeper flush. I might be wrong, but as long as price respects this demand, I’m treating ATOM as a quiet accumulation play while everyone else sleeps on it.  Long
Long
Aptos: bounce or breakdown? key levels to watch todayAptos. Who’s brave enough to catch this falling knife? While the whole alt market is still digesting the recent risk-off mood, Aptos keeps bleeding after headlines about weaker ecosystem activity and shrinking TVL, and the market clearly voted with its feet. Today we’re sitting near fresh lows, so the next move from here usually becomes explosive in either direction.
On the 4H chart, price is grinding inside a bearish channel with no real bounce, but RSI is buried around oversold and starting to curl up. I’m leaning toward a snapback long, targeting the first liquidity pocket around 0.90, then the heavier supply zone near 1.00 where volume last traded serious size. If buyers step in with a strong green 4H candle and expanding volume, this can turn into a classic short-covering squeeze.
My base plan: ✅ accumulate a starter long close to current prices with a tight invalidation under the recent low; take profits into 0.90 and trail the rest toward 1.00. If we lose the low and momentum dies, I’m out and will happily wait for a deeper discount around the next volume node. I might be wrong, but this looks like one of those ugly charts that usually rips right when everyone gives up.