BNS (USA) - Scotiabank Pulling Back Into TrendBank of Nova Scotia has been on a very steady run lately, gaining around 67% over the last year. Commonly known as Scotiabank, they are one of the heavy hitters in Canadian banking but have a large footprint across the Americas. The stock has been trending well as they shift their focus toward more stable growth in the U.S. and Canada.
Fundamentally, the momentum seems to be coming from a solid turnaround plan . They’ve been selling off assets in parts of Latin America and recently took a significant stake in KeyCorp to grow their U.S. presence. Their last earnings report showed a healthy beat and improving profitability across the board. The recent dip in the share price was a reaction to the drop in the whole market and looks like normal profit-taking after such a strong multi-month move, especially with their next quarterly update coming up later this month.
Technically, the chart looks quite clean. The price has pulled back from its recent highs and is currently testing the 20-day SMA , which has acted as support throughout this trend. This move has brought the stock into a much better value area for anyone following the trend. The RSI has reset from overbought levels down to a neutral 55/56, and while the MACD is cooling off , it doesn't look like the trend is broken.
If you like slow and steady, this might be one to keep an eye on.
..................................................
PLEASE NOTE: Nothing I post is trading advice. All investing involves risk, and past performance doesn’t predict future results. Trends can and do end. For 2026 , my goal is to try and post one new asset each day. Something outside the usual gold, silver, BTC, or big tech names. I like to find stocks worldwide showing steady trends with some good gains, a recent pullback, and signs of renewed strength. I don’t necessarily hold positions in these. They are simply companies I find interesting at the time of posting. I’ll often revisit them within a week to see how they went and share any updates. If you enjoy these posts, please BOOST and FOLLOW ME to discover more under-the-radar stocks and businesses from around the world.
.................................................. RSI Indicator LIES! Untold Truth About Relative Strength Index
The Relative Strength Index (RSI ) is a classic technical indicator that is applied to identify the overbought and oversold states of the market.
While the RSI looks simple to use, there is one important element in it that many traders forget about: it's a lagging indicator . This means it reacts to past price movements rather than predicting future ones. This inherent lag can sometimes mislead traders, particularly when the markets are volatile or trade in a strong bullish/bearish trend.
In this article, we will discuss the situations when RSI indicator will lies to you. We will go through the instances when the indicator should not be relied and not used on, and I will explain to you the best strategy to apply RSI.
Relative Strength Index analyzes the price movements over a specific time period and displays a score between 0 and 100.
Generally, an RSI above 70 suggests an overbought condition, while an RSI below 30 suggests an oversold condition.
By itself, the overbought and overbought conditions give poor signals , simply because the market may remain in these conditions for a substantial period of time.
Take a look at a price action on GBPCHF. After the indicator showed the oversold condition, the pair dropped 150 pips lower before the reversal initiated.
So as an extra confirmation, traders prefer to look for RSI divergence - the situation when the price action and indicator move in the opposite direction.
Above is the example of RSI divergence:
Crude Oil formed a sequence of higher highs, while the indicator formed a higher high with a consequent lower high. That confirmed the overbought state of the market, and a bearish reversal followed.
However, only few knows that even a divergence will provide accurate signals only in some particular instances.
When you identified RSI divergence, make sure that it happened after a test of an important key level.
Historical structures increase the probability that the RSI divergence will accurately indicate the reversal.
Above is the example how RSI divergence gave a false signal on USDCAD.
However, the divergence that followed after a test of a key level, gave a strong bearish signal.
There are much better situations when RSI can be applied, but we will discuss later on, for now, the main conclusion is that
RSI Divergence beyond key levels most of the time will provide low accuracy signals.
But there is one particular case, when RSI divergence will give the worst , the most terrible signal.
In very rare situations, the market may trade in a strong bullish trend, in the uncharted territory, where there are no historical price levels.
In such cases, RSI bullish divergence will constantly lie , making retail traders short constantly and lose their money.
Here is what happens with Gold on a daily.
The market is trading in the uncharted territory, updated the All-Time Highs daily.
Even though there is a clear overbought state and a divergence,
the market keeps growing.
Only few knows, however, that even though RSI is considered to be a reversal, counter trend indicator, it can be applied for trend following trading.
On a daily time frame, after the price sets a new high, wait for a pullback to a key horizontal support.
Your bullish signal , will be a bearish divergence on an hourly time frame.
Here is how the price retested a support based on a previous ATH on Gold. After it approached a broken structure, we see a confirmed bearish divergence.
That gives a perfect trend-following signal to buy the market.
A strong bullish rally followed then.
RSI indicator is a very powerful tool, that many traders apply incorrectly.
When the market is trading in a strong trend, this indicator can be perfectly applied for following the trend, not going against that.
I hope that the cases that I described will help you not lose money, trading with Relative Strength Index.
❤️Please, support my work with like, thank you!❤️
I am part of Trade Nation's Influencer program and receive a monthly fee for using their TradingView charts in my analysis.
 Education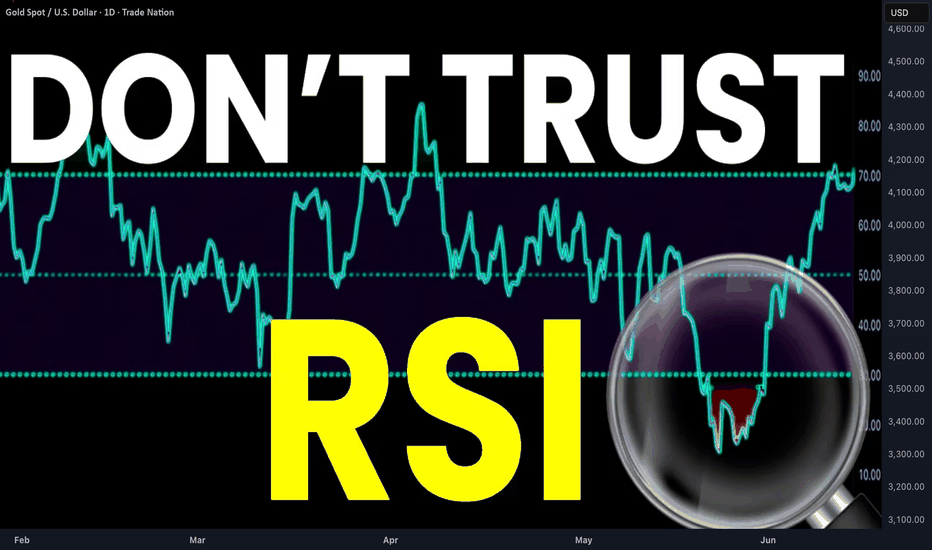
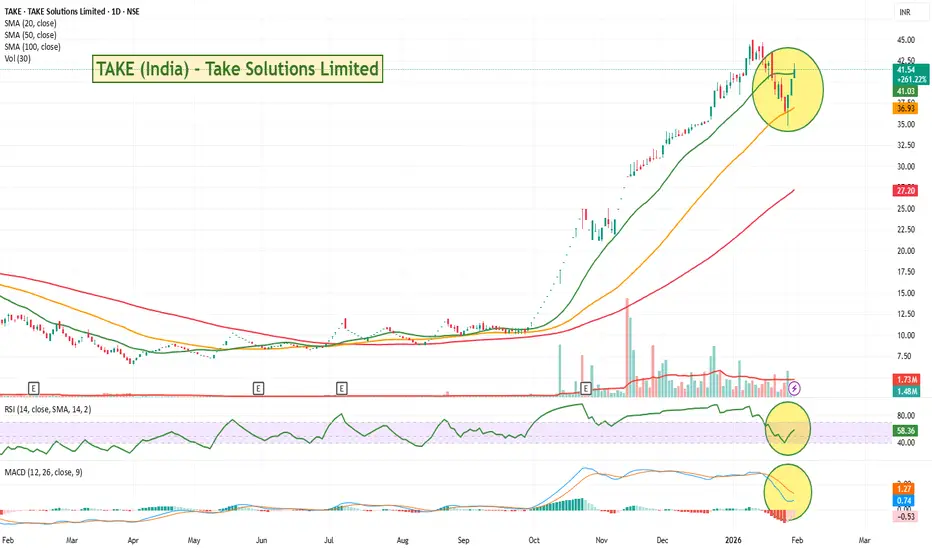
TAKE (India) - Rapid Runner Resuming its Run?Take Solutions Limited has been on a rip over the last few months, racking up gains of over 260% .
Fundamentally, TAKE is much more than a generic tech firm. They are a strong player in the Life Sciences space, operating as a full-service CRO (Contract Research Organization). They support pharma and biotech companies globally, handling everything from Clinical Research and Generics Development to the complex world of Pharmacovigilance (drug safety). With a client roster that includes both large innovator biopharma names and generics manufacturers, they have the "best-in-class" systems to drive outcomes. The market seems to be waking up to the value of this specialized expertise and their global reach.
Technically, the chart is taking a breather. The price hit a resistance level near 45 and we got a deep pullback wick all the way down to 35. The 50 Day ended up providing support, and we have just broken back up above the 20 day which is a classic area for trend traders to step back in. The RSI has reset from overbought levels down to a healthy 58, clearing out some of the FOMO action that was happening.
Could be worth a watch to see if the 20-day line holds.
..................................................
PLEASE NOTE: Nothing I post is trading advice. All investing involves risk, and past performance doesn’t predict future results. Trends can and do end. For 2026 , my goal is to try and post one new asset each day. Something outside the usual gold, silver, BTC, or big tech names. I like to find stocks worldwide showing steady trends with some good gains, a recent pullback, and signs of renewed strength. I don’t necessarily hold positions in these. They are simply companies I find interesting at the time of posting. I’ll often revisit them within a week to see how they went and share any updates. If you enjoy these posts, please BOOST and FOLLOW ME to discover more under-the-radar stocks and businesses from around the world.
..................................................  Short
Short
 Long
Long
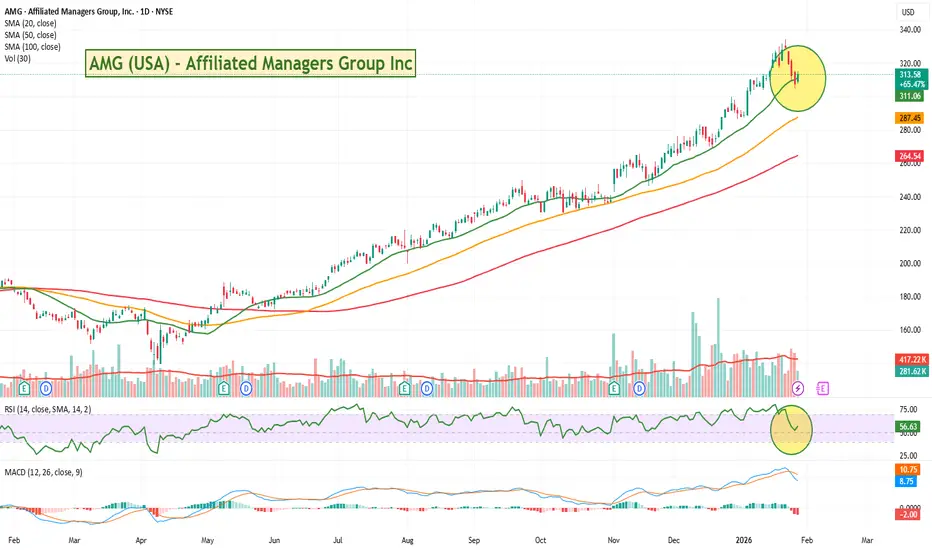
AMG.US - Financial Compounder Testing Support Near HighsAffiliated Managers Group has been a standout performer for those who like quiet, steady winners, putting up a gain of roughly 65% over the last year. Based in Florida, this asset management firm operates with a unique model where they buy equity stakes in boutique investment houses and let them run independently while providing the global scale they need to grow. The stock has been in a very consistent uptrend for most of 2025, showing the kind of momentum that trend followers look for.
Fundamentally, the move has been driven by a clever pivot toward "alternative" assets like private credit and private equity, which now make up a huge chunk of their earnings. They’ve also been aggressive with share buybacks , which helps support the price even when the broader market gets choppy. We’ve seen a bit of a pullback lately, which is likely just some pre-earnings nerves or profit-taking as we approach their February 5th report. It’s normal for a stock to catch its breath after hitting new highs around $330 earlier this month.
Technically, the chart shows a very healthy reset. The price has dipped back toward the 20-day moving average, which has acted as a springboard several times over the last year. You can see the RSI has dropped from overbought levels back into the 50s, suggesting the "hype" has been blown off the top. While the MACD has crossed over to the downside, the selling pressure looks to be stabilizing as the stock finds support. This looks more like a consolidation phase than a trend reversal - but do be aware of earnings only a few days away.
Might be worth a watch.
..................................................
PLEASE NOTE: Nothing I post is trading advice. All investing involves risk, and past performance doesn’t predict future results. Trends can and do end. For 2026 , my goal is to try and post one new asset each day. Something outside the usual gold, silver, BTC, or big tech names. I like to find stocks worldwide showing steady trends with some good gains, a recent pullback, and signs of renewed strength. I don’t necessarily hold positions in these. They are simply companies I find interesting at the time of posting. I’ll often revisit them within a week to see how they went and share any updates. If you enjoy these posts, please BOOST and FOLLOW ME to discover more under-the-radar stocks and businesses from around the world.
.................................................. CIEN (USA) - Optical Infrastructure Holding Key SupportCiena Corp has been a powerhouse in the infrastructure space, delivering a gain of around 200% over the last year. While the headlines focus on the AI chips, Ciena provides the massive optical plumbing needed to actually move that data around.
Fundamentally, the demand for bandwidth is clearly showing up in the numbers. Looking at the quarterly financials snapshot, revenue (the blue bars) hit a high in the most recent quarter, confirming that orders are flowing in. However, you’ll notice the net margin (the orange line) dipped recently. That kind of volatility isn't unusual when a company is scaling hard to meet a rush of demand. Costs often jump before efficiency kicks back in. The driver here remains the frantic build-out of data centers around the world requiring high-speed interconnects.
Technicals show a classic bull flag forming. The price has pulled back from its highs and consolidated above the 50-day SMA (the orange line), which has supported this run for months. We are now back up above the 20-day so will be good to see if it holds this level. You can see the RSI has reset from overbought levels down to a neutral 57, indicating a better value area people like to enter at. The MACD histogram is also shallowing out, suggesting the selling pressure is already drying up. It looks like a standard recovery period before the market decides on the next run.
Might be worth a watch.
..................................................
PLEASE NOTE: Nothing I post is trading advice. All investing involves risk, and past performance doesn’t predict future results. Trends can and do end. For 2026 , my goal is to try and post one new asset each day. Something outside the usual gold, silver, BTC, or big tech names. I like to find stocks worldwide showing steady trends with some good gains, a recent pullback, and signs of renewed strength. I don’t necessarily hold positions in these. They are simply companies I find interesting at the time of posting. I’ll often revisit them within a week to see how they went and share any updates. If you enjoy these posts, please BOOST and FOLLOW ME to discover more under-the-radar stocks and businesses from around the world.
.................................................. IRMD (USA) - Niche MedTech TrendingiRadimed has been a quiet achiever over the last year, racking up a gain of around 67% . Based in Florida, they dominate a very specific niche: non-magnetic medical devices designed to work safely inside MRI rooms. While the big tech names get all the headlines, this little player has established a strong, steady uptrend by owning its corner of the market.
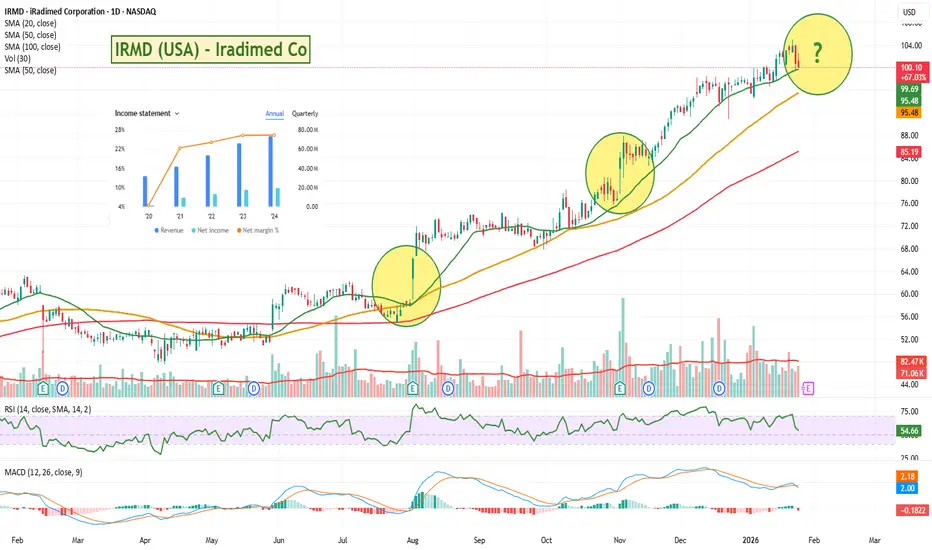
Fundamentally, the story for 2026 is all about their new 3870 Infusion Pump . The rollout is gaining traction and looks to be a major revenue driver this year. The financials back this up with year on year revenue climbing steadily, and they run with impressive net margins around 26% . The recent pause in price likely comes down to two things: natural exhaustion after hitting all-time highs near $104 , and some recent insider selling by the CEO in January. With its next earnings reports only 2 days away, its more of a risky entry but the last couple it has run well - so be careful of your timing and risk management if you like the look of it before this time.
Technically, the chart shows a clear rhythm. The yellow circles I’ve marked showed what happened in the last couple of earnings announcements, and you can see how throughout the move the price typically respects those 20 and 50-day SMAs . Every time it dips into that zone, buyers step back in. Right now, we are seeing a tight consolidation just under the highs. The RSI has cooled off from overbought levels down to a healthy neutral zone, and the MACD is resetting. This "flagging" action often happens right before the next leg up, provided the $95-$98 support level holds.
Could be one to keep an eye on but be aware of the next couple of days and see what happens post earnings.
..................................................
PLEASE NOTE: Nothing I post is trading advice. All investing involves risk, and past performance doesn’t predict future results. Trends can and do end. For 2026 , my goal is to try and post one new asset each day. Something outside the usual gold, silver, BTC, or big tech names. I like to find stocks worldwide showing steady trends with some good gains, a recent pullback, and signs of renewed strength. I don’t necessarily hold positions in these. They are simply companies I find interesting at the time of posting. I’ll often revisit them within a week to see how they went and share any updates. If you enjoy these posts, please BOOST and FOLLOW ME to discover more under-the-radar stocks and businesses from around the world. .................................................. BB + RSI: Ultimate Mean Reversion
BB + RSI: Ultimate Mean Reversion 🍊
🍊 Summary
Most traders use Bollinger Bands or RSI in isolation, but they often lead to "false breakouts" or "riding the bands." This idea breaks down the power of **Confluence**—where mathematical extremes meet market exhaustion—using the **OrangePulse LITE** framework.
---
📊 Visual Breakdown (Analyzing the Screenshot)
1. The Entry: Pure Confluence
Look at the most recent trade on the right side of the chart:
* **Bollinger Bands:** Price pierces the lower band, indicating a statistical deviation from the mean.
* **RSI:** Simultaneously, the RSI drops below 30, confirming that the asset is mathematically oversold.
* **The Result:** This "Sweet Spot" is where the probability of a relief bounce is highest.
2. The "Step-down" Effect (DCA in Action)
Notice the **Yellow line (Average Price)** and **Green line (Take Profit)**:
* Every time a **Safety Order (SO)** is filled (indicated by the small blue arrows), these lines instantly drop.
* **Why this matters:** You don't need the price to return to your original entry to profit. The bot automatically "brings the target to the price."
* In this 1h BTC chart, you can see how the target was brought down significantly, allowing for a much faster exit on the first sign of recovery.
3. Precision & Discipline
Automated trading isn't about "winning every trade" instantly. It's about having a plan for when the market moves against you.
* **Patience:** The bot waits for the exact moment both conditions align.
* **Execution:** No emotions, no hesitation. Just math.
---
⚙️ How to Use This
This exact logic—the confluence triggers, the automated DCA lines, and the real-time status table—is the core engine of the **OrangePulse v3.0 LITE** script.
It's designed to be a reliable "Mean Reversion" tool for traders who want to automate their discipline without complex setups.
 Long
Long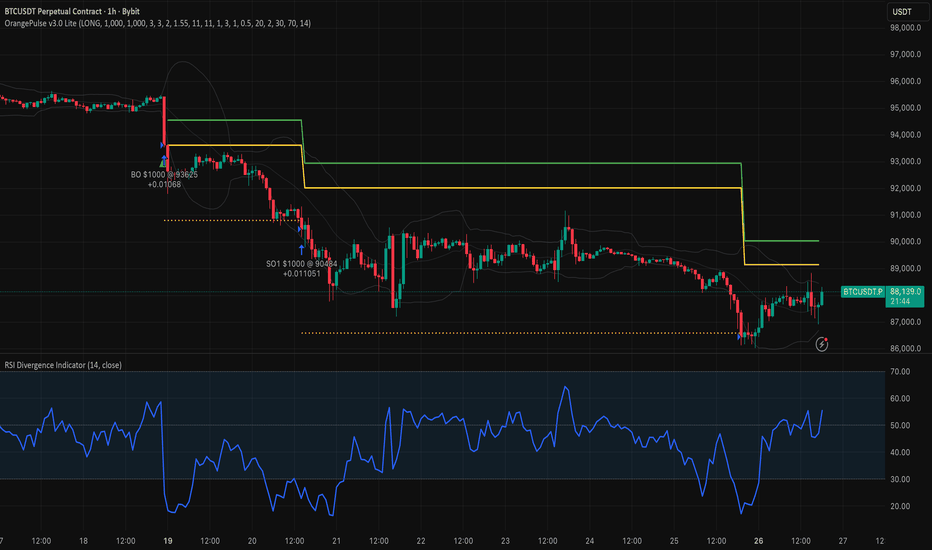
MAHASTEEL (India) - Steel Manufacturer on a Parabolic RunMahamaya Steel has been an absolute standout in the Indian industrial sector, delivering a staggering return of roughly 330% over the last year. The company operates out of Raipur and is a key manufacturer of heavy steel structures like joists, channels, and beams used in major infrastructure and railway projects.
On the fundamental side, the momentum has been backed by a significant jump in profitability, with recent quarterly net profits climbing over 700% compared to the previous year. The company is benefiting from the broad infrastructure push in India, supplying everything from power plants to metro rail projects. The sharp pullback we’ve seen since the start of January looks like a combination of the market digesting these massive gains and some standard profit-taking after the stock hit record highs near the 1,000 INR mark.
Looking at the chart, the price action has finally moved back into what would be considered a much more reasonable value area. After being way overextended, the stock has dropped back to test the 50-day SMA and would be good to see it move back up above here. The RSI has completely reset from extreme overbought territory down to a neutral 45, and the MACD is starting to show the selling pressure might be bottoming out as the histogram bars shorten. It's essentially a high-flyer taking a much-needed breather at a logical support level.
If you think steel has a strong future in India as it goes through its own 21st century modernisation, similar to what China recently went through, then this might be one to keep an eye on.
..................................................
PLEASE NOTE: Nothing I post is trading advice. All investing involves risk, and past performance doesn’t predict future results. Trends can and do end. For 2026 , my goal is to try and post one new asset each day. Something outside the usual gold, silver, BTC, or big tech names. I like to find stocks worldwide showing steady trends with some good gains, a recent pullback, and signs of renewed strength. I don’t necessarily hold positions in these. They are simply companies I find interesting at the time of posting. I’ll often revisit them within a week to see how they went and share any updates. If you enjoy these posts, please BOOST and FOLLOW ME to discover more under-the-radar stocks and businesses from around the world. .................................................. Three Indicators I Use to Read the Market: EMA – RSI – VolumeAfter years of observing different markets—from gold and forex to crypto—I’ve come to a very clear realization: price never moves randomly. Every move only truly matters when it exists within the right context. And to read that context, I don’t need a chart crowded with indicators. I keep just three familiar tools—enough to understand what state the market is in and how I should respond to it.
For me, EMA is the market’s skeleton. When price holds steadily above the EMA lines and pullbacks remain clean and controlled, I can clearly feel that a trend is being maintained—calm, orderly, and without panic. On the other hand, when price stays below EMA and rebounds are weak and short-lived, the picture becomes clear in the opposite direction. What matters most is the slope of the EMA. An upward-sloping EMA tells a very different story from one that is flat or starting to roll over. With just that, I can already tell whether the market is trending, correcting, or stuck in balance. And simply identifying the correct state of the market already determines most of the quality of any analysis that follows. In practice, EMA 34 and EMA 89 are the two levels I rely on the most—they act as familiar anchors to help me orient myself.
RSI plays a different role. It doesn’t give me structure; it gives me rhythm. When RSI stays elevated for a prolonged period, I don’t just see strong price action—I see buyer initiative and sustained conviction. When RSI starts to fade while price hasn’t dropped much yet, that’s when I sense momentum slowing down, like a breath becoming heavier. And when RSI hesitates around the neutral zone, it often coincides with moments when the market needs time—to absorb order flow, rebalance emotions, and prepare before choosing its next direction.
Volume is the final piece—and an indispensable one. Price can break highs or lows, but without volume backing it, that move is still unconvincing to me. When price expands alongside steadily rising volume, I see real participation and genuine commitment from the market. Conversely, when price travels far but volume fails to follow, it usually signals hesitation—a level that hasn’t been fully accepted yet. Volume helps me distinguish between a move with solid backing and one that’s merely technical, driven more by inertia than by belief.
Three indicators, three different perspectives—but when placed together, they form a complete picture of the market. Education 
LUN (Canada) - Copper Giant Resetting After A Solid RunLundin Mining has been a powerhouse lately, up roughly 270% since the lows in 2025. Based in Vancouver, this diversified miner produces copper, zinc, gold, and nickel from operations across the globe.
Fundamentally, on Jan 21st 2026 the company just released strong 2025 results, beating their original copper guidance with a record Q4 at their Caserones mine. However, the recent 13% drop seems to be a reaction to their 2026 outlook. While overall production is stable, they flagged lower mining rates at Candelaria for the first half of the year as they bring a mining contract in-house. The market likely used this "softer" start to 2026 as an excuse to take profits after such a massive run. The long-term story remains intact, with production expected to ramp back up in 2027.
Technically, the pullback has been orderly. The stock dropped to the 20-day SMA which has been providing support throughout the run and which is often where institutional support often steps in during strong trends like this one. The RSI has reset from overbought territory but is turning back up, and the price action inside the highlighted circle shows buyers are starting to absorb the selling pressure. Yesterday (Jan 24, 2026) Haywood Securities also raised their price target to $42 from $32 which shows confidence is still there.
Might be worth a watch if it can hold these levels.
..................................................
PLEASE NOTE: Nothing I post is trading advice. All investing involves risk, and past performance doesn’t predict future results. Trends can and do end. For 2026 , my goal is to try and post one new asset each day. Something outside the usual gold, silver, BTC, or big tech names. I like to find stocks worldwide showing steady trends with some good gains, a recent pullback, and signs of renewed strength. I don’t necessarily hold positions in these. They are simply companies I find interesting at the time of posting. I’ll often revisit them within a week to see how they went and share any updates. If you enjoy these posts, please BOOST and FOLLOW ME to discover more under-the-radar stocks and businesses from around the world. .................................................. SLGL (USA) - Dermatology Trend Taking A BreatherSol-Gel has put in a massive performance over the last year, up around 600% and that's after the recent pull back. That is serious momentum. Based in Israel, they are a dermatology company specializing in treatments for skin conditions using a unique silica-delivery technology.
Fundamentally, there is still optimism here. Just recently, HC Wainwright & Co raised their price target to $110 , which is nearly double the current levels. That kind of analyst support often keeps a trend alive. The current pullback looks like standard profit-taking after the explosive move we saw earlier in the month.
Technically, the price action is cooling off. The stock has dipped from its highs but is holding well above the 50-day SMA. The RSI has come down from overbought territory to a more manageable 56. The MACD is crossing down, confirming the pause, but this consolidation could offer a better entry point if buyers step back in.
Given what buyers were very recently prepared to pay for it, and the analysts very recent $100+ target this may well be worth a watch.
..................................................
PLEASE NOTE: Nothing I post is trading advice. All investing involves risk, and past performance doesn’t predict future results. Trends can and do end. For 2026 , my goal is to try and post one new asset each day. Something outside the usual gold, silver, BTC, or big tech names. I like to find stocks worldwide showing steady trends with some good gains, a recent pullback, and signs of renewed strength. I don’t necessarily hold positions in these. They are simply companies I find interesting at the time of posting. I’ll often revisit them within a week to see how they went and share any updates. If you enjoy these posts, please BOOST and FOLLOW ME to discover more under-the-radar stocks and businesses from around the world.
.................................................. RTW (London) - Trend Following The Biotech RecoveryRTW Biotech Opportunities Ltd has put in a strong performance over the last year, showing gains of a bit over 80% from the 2025 lows. It has been grinding higher in a very defined upward channel for months, showing clear momentum. This London-listed fund offers exposure to a global basket of biopharma and medtech companies. When a beaten-down sector like biotech starts to wake up, diversified funds like this will benefit.
Fundamentally, the story seems to be about a broader sector recovery. Management has noted that the "bear market" in biotech appears to be over, with merger and acquisition activity picking up and generalist investors returning to the space. We also saw some insider buying in Q4, which is typically a reassuring signal for shareholders. The recent pause in price action aligns with a minor dip in December which looks like standard profit-taking after a very strong end to 2025.
Technically, the chart structure remains positive. The price is respecting the parallel channel and holding the trend and we are seeing a move back up after the recent pullback which is a good sign of momentum continuing. The RSI back below 60 for the first time in ages also reflects this profit-taking pullback to more reasonable levels.
Could be one to keep an eye on especially if the biotech rally continues.
..................................................
PLEASE NOTE: Nothing I post is trading advice. All investing involves risk, and past performance doesn’t predict future results. Trends can and do end. For 2026 , my goal is to try and post one new asset each day. Something outside the usual gold, silver, BTC, or big tech names. I like to find stocks worldwide showing steady trends with some good gains, a recent pullback, and signs of renewed strength. I don’t necessarily hold positions in these. They are simply companies I find interesting at the time of posting. I’ll often revisit them within a week to see how they went and share any updates. If you enjoy these posts, please BOOST and FOLLOW ME to discover more under-the-radar stocks and businesses from around the world.
.................................................. TD (USA) - Canadian Bank Running the Channel.Toronto-Dominion Bank has had a solid run, sitting on a gain of a bit under 60% over the last year. Based in Toronto, this is one of the heavyweights in North American banking. Like all banks, it's not the flashiest stock out there, but the trend has been steady and reliable, which is worth considering in these volatile times.
Fundamentally, things look stable. They just announced they are redeeming $1.25 billion in medium-term notes for 2026, effectively clearing that debt off the books. They also confirmed January distributions for their ETFs. This tells us management is comfortable with their capital structure and focused on financial flexibility. The recent pause in price seems less about specific bad news and more about the recent pull back on the overall market having its impact.
Technically, the chart shows a very clean upward channel. We are currently seeing a pullback into the middle of the channel and the RSI is sitting around 57, so arguably the stock price is at a better value area for technical investors. Obviously you would wait to make sure the trend is going to head back up, but looks good so far and global tensions are easing with Trump softening his language and backing off his Greenland threats in the last 24 hours.
Might be worth a watch if you like these slow and steadies.
..................................................
PLEASE NOTE: Nothing I post is trading advice. All investing involves risk, and past performance doesn’t predict future results. Trends can and do end. For 2026 , my goal is to try and post one new asset each day. Something outside the usual gold, silver, BTC, or big tech names. I like to find stocks worldwide showing steady trends with some good gains, a recent pullback, and signs of renewed strength. I don’t necessarily hold positions in these. They are simply companies I find interesting at the time of posting. I’ll often revisit them within a week to see how they went and share any updates. If you enjoy these posts, please BOOST and FOLLOW ME to discover more under-the-radar stocks and businesses from around the world.
.................................................. APZ (Australia) - The Affordable Housing Trend SetterAspen Group has had a really solid run over the last year, putting on a gain of roughly 140% . Based in Australia, they operate in the affordable accommodation sector, managing residential communities, retirement villages, and holiday parks. It isn’t the flashiest business model, but the trend has been incredibly consistent. They have quite a few places that specialise in over 55 living with less than $90k annual salaries and with Australia's rapidly aging population and some of the highest real estate prices in the world, these guys are doing pretty well with lots of demand now and into the future.
Fundamentally, this momentum is being driven by the tight housing market down here. There is a genuine shortage of affordable options, and Aspen fills that gap nicely with lower-cost rentals and homes. Revenue and earnings have generally tracked well because the demand is so sticky.
Technically, the chart structure is very clean. You can see it trading inside a well-defined rising channel. The price has pulled back slightly but is holding up well above the trend support even with todays pullback - caused by the overall market dropping on Greenland tensions. The RSI has cooled down to around 55, which resets the momentum without signaling a reversal. The MACD is flat, which suggests the selling pressure is minimal.
Need to make sure it heads back up before any entry, but certainly might be worth a watch.
..................................................
PLEASE NOTE: Nothing I post is trading advice. All investing involves risk, and past performance doesn’t predict future results. Trends can and do end. For 2026 , my goal is to try and post one new asset each day. Something outside the usual gold, silver, BTC, or big tech names. I like to find stocks worldwide showing steady trends with some good gains, a recent pullback, and signs of renewed strength. I don’t necessarily hold positions in these. They are simply companies I find interesting at the time of posting. I’ll often revisit them within a week to see how they went and share any updates. If you enjoy these posts, please BOOST and FOLLOW ME to discover more under-the-radar stocks and businesses from around the world.
.................................................. AXTI (USA) - Up 900% over the last 12 months. Super Speculative!AXT Inc has had a bonkers run this year, posting gains of nearly 900% over the past twelve months. This company is a specialist in the semiconductor space, specifically making high-performance wafers for when standard silicon isn't enough. If you want to move data using light in an AI data centre which is becoming the standard, then according to them (and potentially their share price) you need the indium phosphide wafers these guys produce. It is classic "picks and shovels" play for the ongoing AI infrastructure build-out.
At the January 2026 Needham Growth Conference, AXT management emphasized their role as the only "pure-play" indium phosphide company available to investors. They explained that AI data centres are hitting a limit with copper wiring and are moving rapidly toward optical connectivity . This shift requires their wafers at both ends of the fibre optic cables. Management expects demand to double in 2026 and potentially double again in 2027. While they acknowledged risks involving Chinese export permits, they are doubling their capacity to capture market share from Japanese competitors, positioning themselves as a critical link in the AI hardware supply chain.
Full conference transcript here: www.tradingview.com
The fundamental story here is driven by a massive shift from copper to optical connectivity . As data speeds increase, the demand for their core material is expected to double annually for the next couple of years. The recent sharp drop in price looks like a mix of standard profit-taking after a vertical move and some nerves regarding Chinese export permits . Since they manufacture in China, they have to navigate some geopolitical bureaucracy, which adds a layer of risk but doesn't seem to have dampened the overall demand for their tech.
Technically, the stock went parabolic and has just had a big pullback. The price is currently moving back toward the 20-day SMA (the green line), which is a much healthier place to look at a trend follower than at the very top of a vertical spike. The RSI has reset from extremely overbought levels down to around 60, giving the chart some room to move again. While the MACD histogram shows that upward momentum is slowing for now, the primary trend remains very strong. It hasn't bounced yet, so it's too early to pick a direction, but still an interesting company at the cutting edge of technology.
Super speculative trade, but if their technology really is the main game in town and they can navigate Chinas export drama then it could be an interesting stock to keep an eye on.
==============================
PLEASE NOTE: Nothing I post is trading advice. All investing involves risk, and past performance doesn’t predict future results. Trends can and do end. For 2026 , my goal is to try and post one new asset each day. Something outside the usual gold, silver, BTC, or big tech names. I like to find stocks worldwide showing steady trends with some good gains, a recent pullback, and signs of renewed strength. I don’t necessarily hold positions in these. They are simply companies I find interesting at the time of posting. I’ll often revisit them within a week to see how they went and share any updates. If you enjoy these posts, please BOOST and FOLLOW ME to discover more under-the-radar stocks and businesses from around the world.
==============================
CM (USA) - Canadian Imperial Looking Interesting.Canadian Imperial Bank of Commerce has been a quiet and steady achiever lately, putting in a solid performance with a gain of around 50% over the last year. While the tech giants grab the headlines, this Canadian banking heavyweight has been trending steadily higher. It’s one of the "Big Five" banks in Canada, meaning it’s generally seen as a stable, dividend-paying bedrock for many portfolios. When a stock like this trends this consistently, I like to pay attention.
Fundamentally, the move seems driven by a mix of resilience in the Canadian economy and the market pricing in a more favorable interest rate environment for 2026. Banks like CM are highly sensitive to rates, particularly regarding their mortgage books, and the outlook for easing rates has likely helped lift the pressure on valuations. The recent pullback looks like standard profit-taking after a very strong run into the low 90s.
Technically, the chart is behaving exactly how a trend follower likes to see. The price has pulled back and has moved back up above the 20-day SMA. I've added a Bollinger band in there and you can see each time it has compressed and the price has cross up through the 20 day its had another run as shown by the highlighted areas. The RSI has cooled off from overbought territory back to a more neutral level, so lets see if history repeats.
Could be one to keep an eye on.
==============================
PLEASE NOTE: Nothing I post is trading advice. All investing involves risk, and past performance doesn’t predict future results. Trends can and do end. For 2026 , my goal is to try and post one new asset each day. Something outside the usual gold, silver, BTC, or big tech names. I like to find stocks worldwide showing steady trends with some good gains, a recent pullback, and signs of renewed strength. I don’t necessarily hold positions in these. They are simply companies I find interesting at the time of posting. I’ll often revisit them within a week to see how they went and share any updates. If you enjoy these posts, please BOOST and FOLLOW ME to discover more under-the-radar stocks and businesses from around the world.
==============================
PAF (London) - African Gold Miner on a RipPan African Resources PLC has been a massive standout on the London market, rallying over 220% in the last year. Based in South Africa, this mid-tier gold producer focuses on low-cost operations and tailings retreatment projects. The trend has been incredibly consistent, and might still be too extended, but we did just get a touch and bounce off that 20-day which has been consistently providing support.
The primary driver here is fairly clear - record gold prices. The company has been capitalizing on the global political uncertainty (which looks to continue) and the precious metals bull market, which has boosted margins and cash flow significantly. The recent pause in the stock price isn't necessarily bad news; it looks like a standard reaction to the underlying commodity cooling off slightly after its own run. The business case remains tied to the macro environment for gold, which is still looking robust.
Technically, the chart remains bullish but is in a tight consolidation phase. The price has pulled back to test the 20-day SMA (the green line), which has acted as immediate support throughout this entire rally. The RSI has cooled off from overbought levels down to a bit under 60, resetting the momentum without breaking the trend structure.
If you think the future of Gold is bright and shiny, this could be one to keep an eye on.
==============================
PLEASE NOTE: Nothing I post is trading advice. All investing involves risk, and past performance doesn’t predict future results. Trends can and do end. For 2026 , my goal is to try and post one new asset each day. Something outside the usual gold, silver, BTC, or big tech names. I like to find stocks worldwide showing steady trends with some good gains, a recent pullback, and signs of renewed strength. I don’t necessarily hold positions in these. They are simply companies I find interesting at the time of posting. I’ll often revisit them within a week to see how they went and share any updates. If you enjoy these posts, please BOOST and FOLLOW ME to discover more under-the-radar stocks and businesses from around the world.
============================== 007660 (Korea) - ISU Petasys Major Momentum RunnerISU Petasys Co., Ltd. has had an incredible run, gaining over 360% in the last year. Based in South Korea, they are a major player in manufacturing multi-layer printed circuit boards (PCBs) used in networking and AI infrastructure .
The fundamental story here is all about the demand for high-performance computing and data centres. As a supplier to global tech giants, they’ve ridden the AI wave hard. The recent pullback doesn't look like a business failure; it looks like standard profit-taking after the stock got a bit ahead of itself. The demand for high-spec network boards in the AI space remains a strong driver.
Technically, the pullback has been a deep 30% drop back into value . Price fell through the shorter-term averages and is now looking like it is recovering and moving away from the more critical 100-day SMA (the red line). This is often where longer-term trends find support after a deep correction. The RSI has cooled all the way down to a neutral 49, resetting the overbought conditions we saw earlier. The MACD is still negative, but the selling pressure seems to be slowing down as price consolidates in this zone.
Might be worth a watch to see if it runs again. AI led demand isn't going away any time soon.
==============================
ABOUT ME: Global TradingView Moderator (English) and full-time trader. I focus on top-performing stocks worldwide , trading momentum and clean trend continuations after pullbacks. I use a trailing stop customised for each stock to manage risk, lock in gains, and exit when the trend ends. Nothing I post is trading advice. I simply like to highlight interesting companies from around the world that may be worth a closer look. Please give this idea a BOOST if you found it interesting, and FOLLOW ME to discover more standout stocks and businesses from global markets.
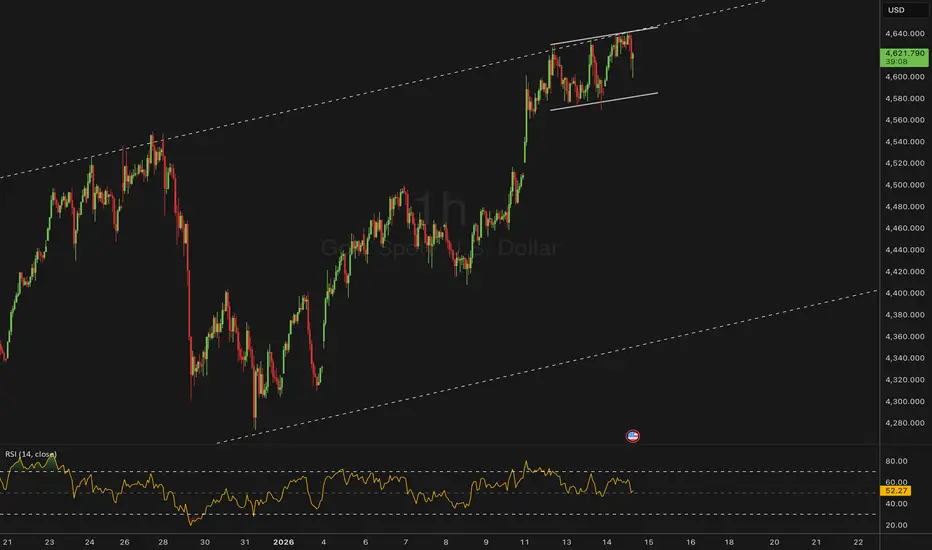
============================== Gold | RSI Pressure Near 4,500 – Inflection Zone in FocusOn the intraday timeframe, price continues to respect the ascending channel, yet recent highs are forming with RSI failing to expand. Momentum has rolled back toward the midline, suggesting upside follow-through is becoming harder to sustain at elevated levels.
4,500 stands out as both a psychological level and a region where momentum has previously stalled, increasing its relevance as a short-term decision point.
Scenarios:
If 4,500 holds:
RSI stability or a higher low could allow price to consolidate and reattempt the upper channel boundary.
If 4,500 gives way:
A loss of momentum alongside RSI slipping below the midline would open scope for a deeper mean reversion toward channel support.
Catalysts:
US data, real yields, and broader risk sentiment remain key inputs for near-term momentum shifts.