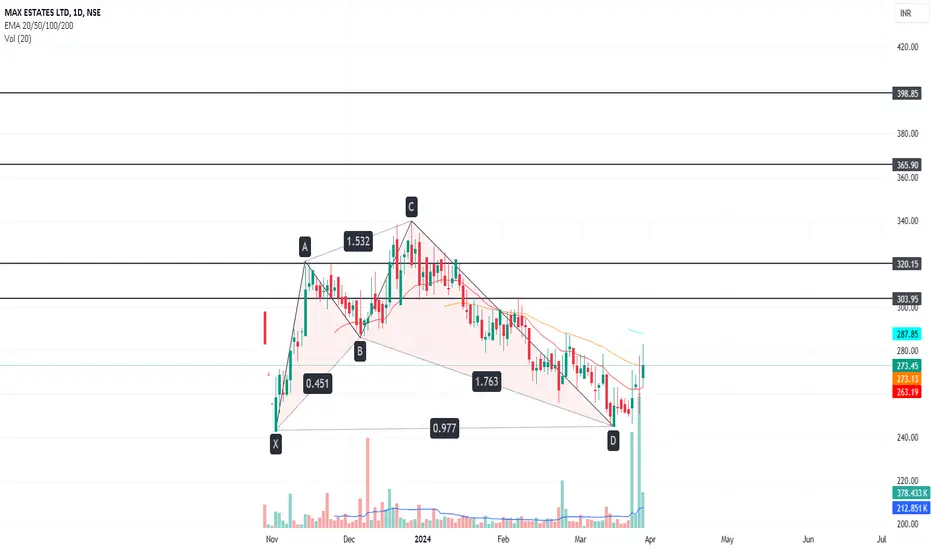
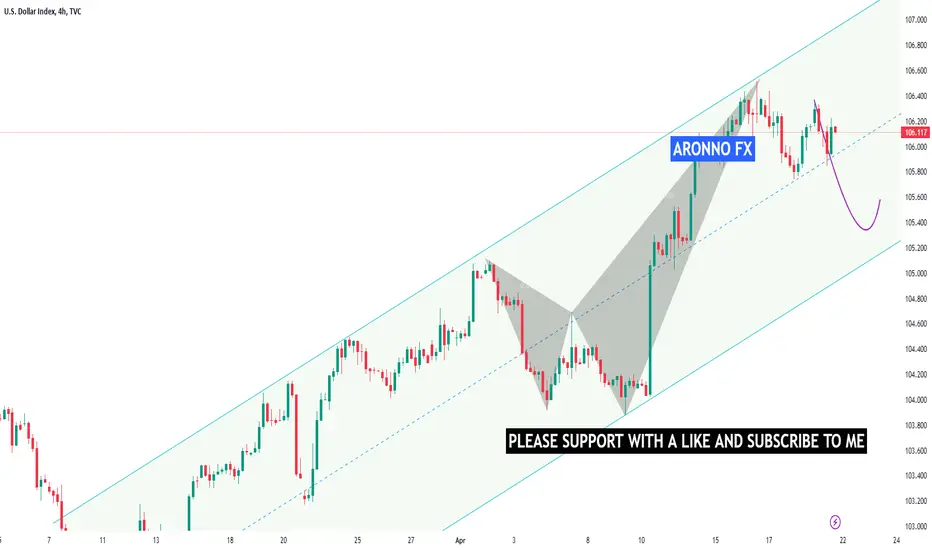
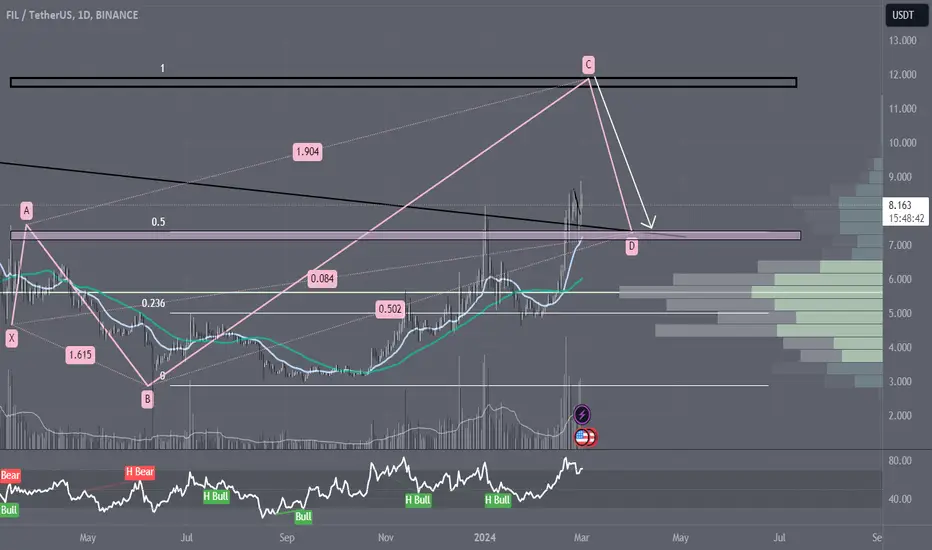
Bitcoin (BTC) Price Analysis: Preparing for the Bearish AbyssIn this technical forecast, we delve into the darker recesses of Bitcoin's potential price journey. We observe a concerning configuration on the BTCUSD chart where the currency is currently grappling with critical support levels.
Current Dynamics:
The price has recently retracted from a peak, teasing the possibility of a significant downtrend.
A descending channel formation can be seen, indicating a tightening bearish grip on the market momentum.
Worst Case Trajectory:
Should the pr
Shark
GBPUSD Analysis: Trend Continuation TradingTrade Strategy: Trend Continuation
- Key Level (1-hourly chart): Retest at 1.2419
- Additional Setup (4-hourly chart): Bullish Shark Pattern at 1.2141
Analysis:
- Approach: Identifies potential opportunities for trend continuation trading
- Key Level: Looks for a retest at 1.2419 on the 1-hourly chart as an entry point
- Additional Setup: Considers stretching the target to 1.2141, the completion of a Bullish Shark Pattern on the 4-hourly chart
Trade Plan:
- Entry Point (1-hourl
DXY CHART VIEW
Hello Traders, here is the full analysis for this pair,
let me know in the comment section below if you have any questions,
the entry will be taken only if all rules of the strategies will be
satisfied. I suggest you keep this pair on your watch list and see if
the rules of your strategy are satisfied.
Dear Traders,
If you like this idea, do not forget to support it with a like and follow.
Potential SHARK Harmonic pattern forming on Natural Gas📈 Keep an eye on Natural Gas! 🦈 Potential SHARK Harmonic pattern spotted 📉
This pattern, known for signalling trend reversals 🔄, is gaining attention as it shows distinct Fibonacci ratios and price swings. If confirmed, it could mean significant price movements ahead.
The pattern involves four key points: the initial impulse leg, a corrective retracement, an extension leg, and a final reversal leg. Traders are watching closely as price action approaches the projected reversal point 🎯. Confirma
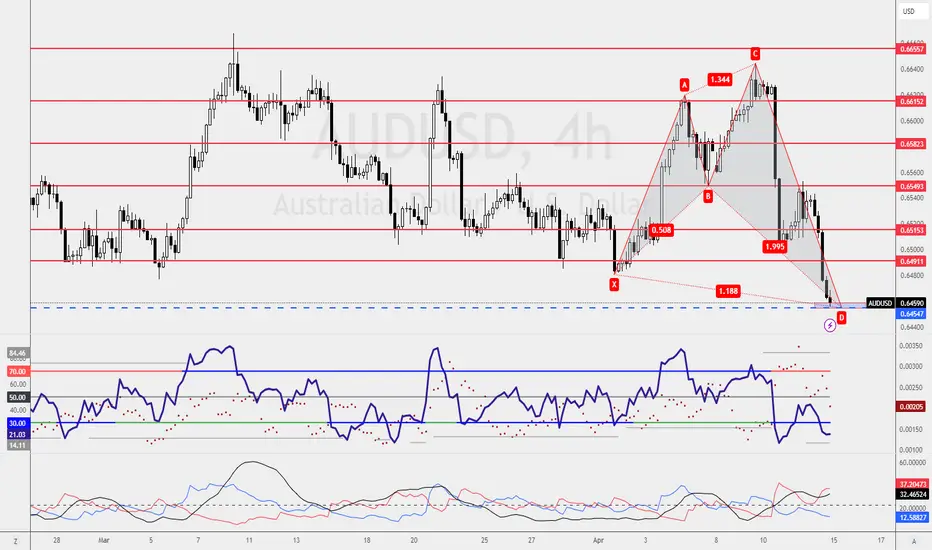
AUDUSD Analysis: Bullish Shark Pattern- Trade Strategy: Bullish Shark Pattern
- Key Level: 0.6454 (Retest Level)
- Challenge: Strong Bearish Movement
Analysis:
- Importance: Highlights the difficulty of trading a Bullish Shark Pattern amid strong bearish pressure
- Technical Analysis: Identifies a Bullish Shark Pattern on the AUDUSD chart
- Challenge: Requires a 3-bar reversal and candlestick confirmation for a viable buying opportunity
Trade Plan:
- Entry: Consider a conservative entry at the retest level of 0.6454
- Con
NZDJPY Analysis: Bullish Combo Trade SetupTrade Strategy: Combo Trade (Bullish Deep Gartley + Bullish Shark)
Key Levels:
- Bullish Deep Gartley Pattern: 4-hourly chart
- Bullish Shark Pattern: 1-hourly chart
- Trading Zone: Coincides with Bullish Shark completion
Analysis:
- Importance: Utilizes a combo trade strategy for enhanced risk management and profit potential
- Technical Analysis: Identifies a Bullish Deep Gartley Pattern on the 4-hourly chart and a Bullish Shark Pattern on the 1-hourly chart
- Trade Management: Enables a
GBPUSD Analysis: Support and Resistance Trade SetupTrade Strategy: Support and Resistance
Key Levels:
- Support at 1.2435 (1-hourly chart)
- Resistance at 1.2534 (1-hourly chart)
Analysis:
- Importance: Utilizes support and resistance levels for trading opportunities
Trade Plan:
- Buying Opportunity: Look for buy entries near support at 1.2435
- Shorting Opportunity: Consider shorting near resistance at 1.2534
Insights:
GBPUSD presents support and resistance trading opportunities on the 1-hourly chart. Traders can consider buying n
Bella Protocol (BEL) completed a setup for upto 87% pumpHi dear friends, hope you are well and welcome to the new trade setup of Bella Protocol (BEL).
Previously we caught nice pump of BEL as below:
On a 4-hr time frame, BEL has completed a bullish Shark move for the next price reversal.
Note: Above idea is for educational purpose only. It is advised to diversify and strictly follow the stop loss, and don't get stuck with trade.
Frontier (FRONT) a setup for upto 19.50% pumpHi dear friends, hope you are well, and welcome to the new update on Frontier (FRONT) token.
Previously we caught almost 19% pump of FRONT as below:
Now on a daily time frame, FRONT with Bitcoin pair is about to complete a bullish Shark move for the next price reversal move.
Note: Above idea is for educational purpose only. It is advised to diversify and strictly follow the stop loss, and don't get stuck with trade.
FLong
AUDNZD | Hidden Bearish Divergence | Harmonic Bearish Shark The AUDNZD chart currently shows the formation of a XABCD Harmonic Shark Bearish Pattern, indicating a Potential Reversal Zone (PRZ). Additionally, there is a hidden bearish divergence, suggesting that the current uptrend is likely to reverse into a downtrend. Furthermore, on the daily chart, the price has just touched a strong daily resistance zone, which also serves as an Order Block (OB). This action confirms the bearish OB and all these indicators collectively suggest a shift in the tren
Bullish Beautifull Golden Shark Pattern Will Start at 1905 $the detail is shown in the above Chart.
I made this Idea based on Candlestick Analysis and Harmonic pattern.
Bullish Shark Pattern Will Start at 1905$.
The Golden Shark recently bounced back from the 0.88 Fibonacci level at $1,952
And 1 Fibonacci level at $1,936.
So we expect gold to start rising at the 1.13 level based on the shark pattern.
Good Luck
SEYED.
Counter-Trend for Greater ProfitsThis week, I'm looking at NZDJPY with a bearish perspective, and here's my trade plan:
1. Bearish Shark Pattern Confirmation at 91.74: I'll be patiently waiting for the Bearish Shark Pattern to confirm at the level of 91.74. This level coincides with the formation of a Head & Shoulders pattern, adding confluence to the bearish setup.
2. Extended Trading Targets: If the Bearish Shark Pattern sets up as anticipated, I'll extend my trading targets beyond the traditional Target1 and Target2. B
Short on EURUSDThis week, I'm leaning towards a shorting opportunity on EURUSD for a couple of reasons:
1. **Bearish Shark Pattern on Daily Timeframe:** The presence of a Bearish Shark Pattern on the daily timeframe suggests a potential downward movement in the price.
2. **Breakthrough of Bullish Gartley Pattern:** The Bullish Gartley Pattern on the 4-hourly chart breaking through the Potential Reversal Zone (PRZ) indicates a weakening bullish sentiment.
3. **Waiting for Retest:** I'll be patient and wait f
BOIL: Set for a Potential Bullish Reversal at Bullish Shark PCZNatural Gas on an intra-week basis seems to be in a position to Bullishly Reverse as it sits at the PCZ of a potential Bullish Shark with slight Bullish Divergence near the previous month's low. My target will be anywhere between $16 and $20 though it could always go higher.
Anticipating a Buying Opportunity on Daily ChartEURUSD is catching my attention, and here's my perspective:
1. Bearish Shark Pattern on Daily Chart:
- For traders seeking shorting opportunities, there's a Bearish Shark Pattern on the Daily chart.
- The completion of this pattern might indicate a potential bearish move.
2. Buying Opportunity at 1.0879:
- Personally, I'm eyeing a buying opportunity on EURUSD.
- Despite a flawed Bullish Shark Pattern, I'm looking to enter long at 1.0879.
Share your thoughts and trade plans for EURUSD in t
RSI Divergence and Bearish Shark Pattern Combo TradeToday, let's delve into an intriguing setup on GBPJPY that combines a Weekly Chart RSI Divergence with a 1-hourly Bearish Shark Pattern:
1. Weekly Chart RSI Divergence:
- Observe the RSI Divergence on the Weekly Chart, signaling a potential weakening of the bullish trend.
- This divergence might serve as a precursor to a reversal or retracement.
2. 1-hourly Bearish Shark Pattern at 190.72:
- Look for a shorting opportunity as the Bearish Shark Pattern completes at 190.72 on the 1-hourly
Bullish 5-0 vs. Type2 Bearish Shark PatternIf you're navigating conflicting biases, here are two potential setups:
1. Bullish 5-0 Pattern at 149.96: Long Opportunity
- Engage in a long position based on the completion of the Bullish 5-0 pattern at 149.96.
- This pattern signals a bullish bias, providing an opportunity for traders expecting an upward move.
2. Type2 Bearish Shark Pattern at 150.67: Shorting Opportunity
- Consider a short position if the Type2 Bearish Shark Pattern completes at 150.67.
- This approach factors in the p
Science of Trading ApproachToday, I'm excited to share a detailed approach for trading GBPUSD. If you're considering a short position, here's a comprehensive strategy:
1. 1-Hourly Chart: Shark Patterns at 1.2676
- Wait for Shark Patterns to complete at 1.2676 on the 1-hourly chart.
- Look for a trading combo within the chart when the market retests the Trendline Break (red line).
- Ensure the market doesn't violate the trendline during this process.
2. 4-Hourly Chart: Bearish Gartley Pattern at 1.2725
- The ideal
EURUSD Type2 Bullish Shark Pattern - Two-Trade StrategyI'm pleased to share an update on the EURUSD Type2 Bullish Shark Pattern trade. If you've been following my TradingView post, you might have already profited from the first target, and now we're looking at a potential second target.
Here's the current strategy:
- First Target : Already Profited
- Second Target: Awaiting Fulfillment
In the event of a retracement to 1.0815, I am considering engaging in an additional long position.
This strategy involves a Double Bottom retest trade. Essent
AUDIO with the sharkAUDIOUSD with the shark harmonic, creating a higher low, and currently on breakout watch.
Keep the stop loss in place, take some profit at each target, and once target 1 is achieved, move your stop loss up to the entry level. Stop loss is triggered upon DAILY candle close confirmation.
ALong