TEDS Swing Trading Analysis | AU Bank 1H long setup | 14 July 26TEDS Swing Trading Analysis | Every Recovery Is Not an Entry
One of the most common trading mistakes is assuming that every price bounce marks the beginning of a new trend.
The TEDS (Trend Exhaustion Detection System) is designed to help traders avoid impulsive decisions by waiting for structured confirmation before planning a trade.
Chart Observation
🔹 After the recent decline, the framework entered a Long Queue, signalling that the market required observation rather than an immediate buy.
Wolfe Wave
TEDS MCX Crude Oil Analysis | 3H Short Setup | 14 July 26TEDS Commodity Analysis | A Plan Is More Valuable Than a Prediction
Commodity markets can move rapidly, but successful trading is built on preparation—not reaction.
The TEDS (Trend Exhaustion Detection System) follows a structured process that helps traders wait for confirmation before planning a trade.
Chart Observation
🔹 The previous TEDS Sell Signal demonstrated how a structured setup develops when predefined conditions are met.
🔹 After the recent upward move, the framework has identifie
USDCAD - From consolidation to downward distributionFX:USDCAD is forming a reversal pattern following its recent strong rally. The market appears to be transitioning from a consolidation phase into a distribution phase
The U.S. dollar has entered a period of consolidation, while the Canadian dollar is beginning to strengthen, putting additional pressure on the pair.
After the strong advance, USDCAD moved into a 1.4150–1.4250 trading range. Instead of continuing higher, price is now showing signs of a reversal. Buyer participation may lead t
GOLD - A countertrend correction before a decline FX:XAUUSD has reversed lower from the 4120–4133 resistance zone—exactly the scenario we had been anticipating since the end of last week—and is now testing the 4050 support area while forming a false breakout. The fundamental and geopolitical backdrop remains weak, suggesting that the broader decline may continue
Gold fell sharply on Monday, breaking below the $4100 level as renewed tensions in the Middle East boosted the U.S. dollar. Although the dollar is currently consolidating, it rema
DXY BULLISH REVERSAL: Major Trendline Breakdown Confirmed!DXY BULLISH REVERSAL: Major Trendline Breakdown Confirmed! 🚀
Description:
The U.S. Dollar Index (DXY) has confirmed a significant bullish market structure shift on the 2h timeframe. After a prolonged bearish phase, price has aggressively forced a clean breakout above the long-standing dynamic descending trendline resistance. This structural displacement confirms that the immediate institutional order flow has shifted from sell-side dominance to buy-side accumulation. We anticipate a continued b
XAUUSD CRASH IMMINENT: Major Trendline Breakdown Confirmed!XAUUSD CRASH IMMINENT: Major Trendline Breakdown Confirmed! 📉
Description:
Gold (XAUUSD) has confirmed a significant bearish market structure shift on the 1h timeframe. After failing to sustain momentum within the consolidation range, price has aggressively forced a clean breakdown below the long-standing dynamic ascending trendline support. This structural displacement confirms that the immediate institutional order flow has shifted from buy-side accumulation to sell-side dominance. We anticip
XAUUSD — Is 4,080 the Sell Trap?Gold is still moving inside a descending price channel.
Price is trading around 4,050 - 4,060, right near the middle zone of the channel.
This is not a clean buy area.
And it is not the best place to chase a sell either.
For me, today’s chart is about one question:
Will gold retest the sell zone first before dropping deeper?
The simple read
Gold remains under short-term bearish pressure while price stays inside the descending channel.
The nearest sell reaction area is around 4,080 - 4,091.
Th
All Eyes Are on Today’s Key CPI Report.Market Outlook
Trend
* The medium-term trend remains bearish, with price continuing to trade below the descending trendline.
* Although price is recovering from the support zone, it has yet to break above the confluence of the descending trendline and horizontal resistance. Therefore, the bearish trend still has the upper hand.
Resistance Levels
🔵 4,058 – 4,060 – Near-term resistance and the first key breakout level.
🔵 4,089 – 4,091 – Major resistance, aligned with the descending trendline
XAUUSD: ABC Recovery Is Forming After the Elliott Drop
Gold is trying to recover after completing a sharp bearish Elliott wave sequence near the lower price area. From Kelly’s view, the market has already reacted from the recent low, but the current move still looks more like an ABC corrective recovery rather than a confirmed bullish reversal.
The key idea is simple: gold may continue to rebound in the short term, but the reaction around each resistance zone will decide whether buyers can keep control.
⟡ Market structure
The chart shows gold pr
XAUUSD — Bearish Structure Holding Below Trendline
Gold is trading around $4,022 after rejecting from the short-term recovery area and moving back into the FVG sideways zone. The current structure remains bearish because price is still trading below the descending trendline, while the recent BOS confirms that sellers are still controlling the short-term direction.
From an SMC perspective, gold failed to build a strong bullish recovery after the previous downside move. Price rejected from the VL area, broke lower structure, and is now consolid
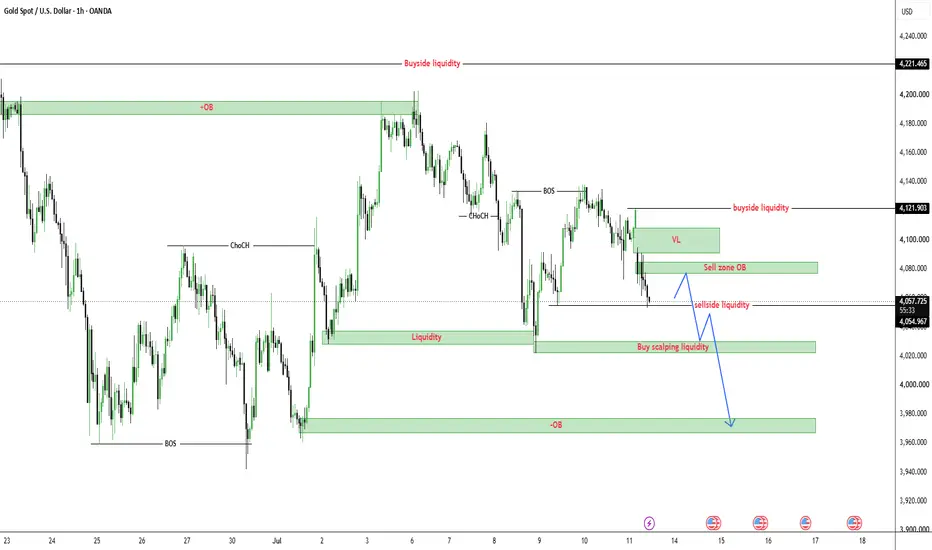
XAUUSD — Bearish Structure, Sell Around OB
Gold is trading around $4,057 after breaking down from the short-term recovery structure. Price has rejected from the upper reaction area and is now pressing directly into the sell-side liquidity around $4,055, showing that sellers are still controlling the current structure.
From an SMC perspective, gold has already shown a bearish shift after failing to hold the previous bullish recovery. The recent move created weakness below the local BOS area, then price dropped strongly into the lower l
Ajmera Breakout AJMERA — Bull Flag Retest After Sharp Recovery Rally
Ajmera Realty & Infra India bottomed out near ₹80 in April 2026 and staged a strong recovery rally, rallying past ₹140 by early July. Since that peak, price has pulled back into a descending channel/bear flag — a short-term corrective structure within the larger uptrend — with lower highs and lower lows contained by two parallel trendlines.
Key observations:
Current price: ₹136.74, trading near the flag's upper trendline.
Immediate support/de
BITCOIN - Retest of the 64,500 liquidity zone BINANCE:BTCUSDT.P remains within the 58,000–67,000 trading range, established as part of the broader bearish trend. Locally, the market is testing the upper boundary of the consolidation zone at 61,000–64,500, with the primary focus now on the resistance area
Bitcoin is currently caught between three major forces: the hawkish FOMC minutes, unstable ETF flows—with outflows resuming after three consecutive days of inflows—and ongoing geopolitical uncertainty. The market still lacks a strong
XAUUSD: Bearish Elliott Wave Points Towards Fibonacci Targets
Gold is moving under renewed downside pressure after failing to hold the recovery structure above the 4,100 area. From Kelly’s view, the current chart suggests that a bearish Elliott wave sequence is developing, and price may continue lower if the sell zone remains defended.
The key idea is simple: gold is still weak below resistance, and the next downside targets are now guided by the Fibonacci structure.
⟡ Market structure
The chart shows gold rejected from the upper recovery area and sta
MASON XAUUSD – Trendline Break May Target Fibonacci
XAUUSD is trading around 4,071 after losing short-term recovery momentum near the Ichimoku structure. Price is now testing the rising trendline support, and the early-week focus is on whether gold can hold this structure or break lower.
The priority view is bearish if gold breaks below the trendline and strong support area. A clean breakdown may open the way toward the Fibonacci extension targets.
Technical View
Gold is currently moving inside a tightening structure between the descending res
XAUUSD: Weekly Breakout May Extend Towards Fibonacci Targets
Gold is showing a stronger recovery structure after breaking away from the previous bearish pressure. From Kelly’s view, the market is no longer moving only as a weak correction. Price is now trying to build a continuation structure after breaking the descending trendline, and the next weekly path may open towards higher Fibonacci targets if buyers keep control.
The key idea is simple: gold has shifted into a more constructive recovery phase, but confirmation above nearby resistance is still
XAUUSD: Bullish Continuation Needs the ABC Buy Zone◈ XAUUSD: Bullish Continuation Needs the ABC Buy Zone
Gold is still holding a constructive recovery structure after the latest rebound from the lower area. From Kelly’s view, the current pullback looks more like an ABC correction inside a bullish continuation setup, rather than a full bearish reversal.
The key idea is simple: gold may correct first, but the bullish path remains active if price holds the Fibonacci buy zones.
⟡ Market structure
The chart shows gold recovered strongly from the
MASON XAUUSD – Accumulation Inside Bearish Channel
XAUUSD is trading around 4,120 while still moving inside the medium-term descending channel. Although the broader structure has not fully broken out yet, gold is showing strong accumulation around the lower-middle area of the channel.
The priority view is that gold may continue building a base above the 4,080–4,095 buy zone before attempting a stronger medium-term recovery toward the upper resistance zones.
Technical View
Gold is still inside a bearish price channel on the 6H structure. The
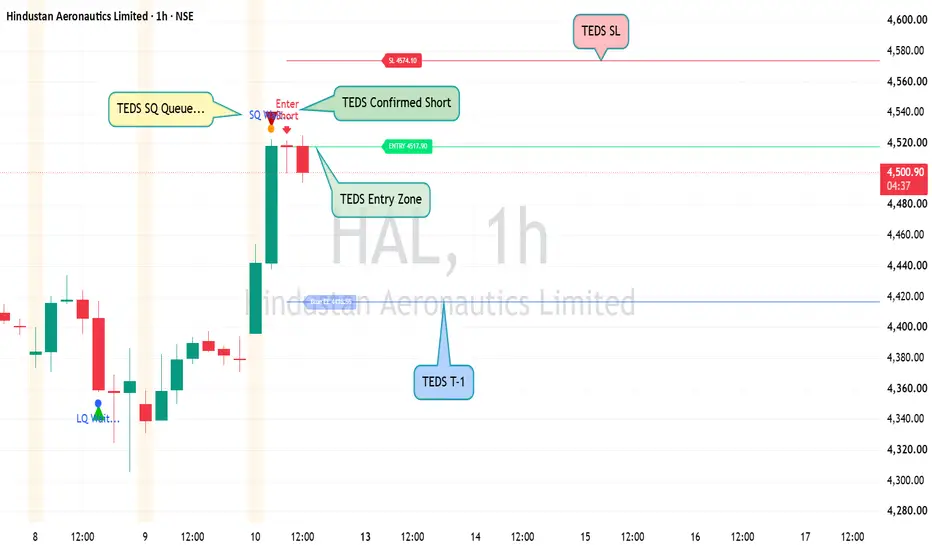
TEDS Swing Trading Analysis | HAL 1H | 10 July 26TEDS Swing Trading Analysis | Confirmation Over Prediction
Strong price moves often create excitement, but disciplined traders know that a move alone is not a trading setup.
The TEDS (Trend Exhaustion Detection System) follows a structured approach by waiting for confirmation before considering a trade.
Chart Observation
🔹 After a strong upward move, the framework identified a TEDS Short Queue, signalling that the market had entered a potential decision zone.
🔹 Instead of initiating an imme
XAUUSD — Bullish Channel Holds Above Buy Zone
Fundamental Analysis
Gold is still reacting to USD momentum, Treasury yields, and upcoming U.S. macro data. For now, the short-term structure remains positive while price continues to hold inside the rising channel.
Technical Analysis
On the 2H chart, XAUUSD is trading around 4,142 and still respecting the bullish channel structure. The main buy order trendline zone is around 4,141 - 4,143. If price holds this area, buyers may continue to defend the trend and push gold toward the liquidity zon
MASON XAUUSD – Bullish Pullback Before Mid-Term Rally
XAUUSD is trading around 4,123 after recovering from the short-term correction zone. Price is still holding above the main uptrend trendline, while the current pullback is moving around the Fibonacci reaction area.
The priority view remains bullish in the medium term, as long as gold continues to hold above the buy order zone and the rising trendline support.
Technical View
Gold is still moving inside a bullish recovery structure. The higher low formation from the previous support area shows
Crash in MorphousdtHello Traders!
MORPHOUSE is at the peak and bulls are not able to push it further and market is forming bearish pattern. There will be a crash in Morphousdt.
We can see a rising triangle in MORPHOUSE and there will be a crash soon after breakout and there are multiple bearish patterns in Morphousdt.
We are selling Morphousdt from 2.1
Stoploss 2.2695(-7.9%)
Target 1.7612(+16.2%)
My goal is to be recognized as one of the highest win-rate traders in the TradingView community. :)
Trade Analy
EURUSD — Bearish EMA Trend, Sell From Fibonacci Value ZoneEURUSD — Bearish EMA Trend, Sell From Fibonacci Value Zone
Fundamental Analysis
EURUSD remains under pressure as traders continue to watch USD momentum, Fed expectations, and upcoming macro data.
For now, the main structure still favours sellers while price trades below the higher EMA resistance zone. Any recovery should be viewed as a corrective pullback unless EURUSD can reclaim the main sell zone with strong confirmation.
Technical Analysis
On the 2H chart, EURUSD is still moving in a be
XAUUSD — Bullish Setup Holding Above Buy Zone
Fundamental Analysis
Gold is still reacting to USD momentum, Treasury yields, and upcoming U.S. data. For now, the short-term structure remains positive while buyers continue to defend the recovery trend.
Technical Analysis
On the 1H chart, XAUUSD is trading around 4,100 and holding above the rising trendline. The key buy order zone at 4,087 - 4,092 is acting as the main value area. If price holds this zone, the bullish structure can continue toward the day high at 4,118, then the liquidity a