NASDAQ EXPECTED VOLATILITY
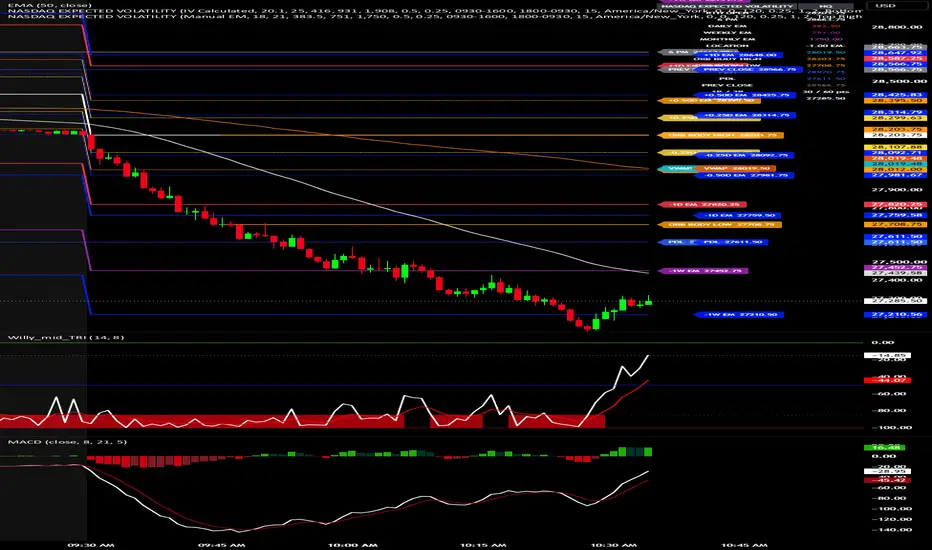
NQ
AI Overview
The Nasdaq-100 30-day implied volatility sits around 22.1%, while near-term market expectations and broader sentiment have spiked sharply as the Nasdaq Composite tumbled 5.52% to 24,315.00 amid a tech and chip stock sell-off following recent midterm election results.
Key Nasdaq Volatility Metrics
• Nasdaq-100 Implied Volatility (NDX IV): Approximately 22.1% for 30-day options, while at-the-money options for near-term expirations have traded around 26.3%.
• Cboe NASDAQ-100 Volatility Index (VXN): Measures the market's expectation of 30-day volatility derived from Nasdaq-100 option prices.
• Nasdaq-100 Volatility Index (VOLQ): Tracks 30-day implied volatility using an at-the-money focused selection of Nasdaq-100 options.
• GARCH Volatility Forecast: Long-run and near-term GARCH models for the Nasdaq Composite project a baseline volatility around 21.9% to 22.1%, with shock decays tracking a 52-trading-day half-life.
• Market Context: The broader Cboe Volatility Index (VIX) surged roughly 50% to 24.98 as the Nasdaq entered correction territory, dropping more than 10% from its early-October highs.
AI Overview
The Nasdaq-100 30-day implied volatility sits around 22.1%, while near-term market expectations and broader sentiment have spiked sharply as the Nasdaq Composite tumbled 5.52% to 24,315.00 amid a tech and chip stock sell-off following recent midterm election results.
Key Nasdaq Volatility Metrics
• Nasdaq-100 Implied Volatility (NDX IV): Approximately 22.1% for 30-day options, while at-the-money options for near-term expirations have traded around 26.3%.
• Cboe NASDAQ-100 Volatility Index (VXN): Measures the market's expectation of 30-day volatility derived from Nasdaq-100 option prices.
• Nasdaq-100 Volatility Index (VOLQ): Tracks 30-day implied volatility using an at-the-money focused selection of Nasdaq-100 options.
• GARCH Volatility Forecast: Long-run and near-term GARCH models for the Nasdaq Composite project a baseline volatility around 21.9% to 22.1%, with shock decays tracking a 52-trading-day half-life.
• Market Context: The broader Cboe Volatility Index (VIX) surged roughly 50% to 24.98 as the Nasdaq entered correction territory, dropping more than 10% from its early-October highs.

Exención de responsabilidad
La información y las publicaciones no constituyen, ni deben considerarse como, asesoramiento o recomendaciones financieras, de inversión, de trading u otro tipo, proporcionadas o respaldadas por TradingView. Obtenga más información en Condiciones de uso.
Exención de responsabilidad
La información y las publicaciones no constituyen, ni deben considerarse como, asesoramiento o recomendaciones financieras, de inversión, de trading u otro tipo, proporcionadas o respaldadas por TradingView. Obtenga más información en Condiciones de uso.