OPEN-SOURCE SCRIPT
Institutional Zone Mapper [JOAT]
Institutional Zone Mapper [JOAT]
Introduction
Institutional Zone Mapper [JOAT] is an open-source overlay indicator that detects swing-pivot order blocks — the last impulsive candle preceding a significant price displacement — and renders them as persistent box-based zones with session-color-coded borders, a four-component strength score from 0 to 10, touch-count tracking, and a configurable mitigation lifecycle. The indicator identifies the candle immediately before a confirmed swing pivot, verifies that a meaningful ATR-scaled displacement followed, and places a zone around that candle's midpoint. Zones are born with a strength score derived from displacement magnitude, session context, age, and zone height — allowing traders to instantly distinguish premium, high-conviction zones from weak, low-probability ones.
The core problem this indicator solves is that most order block tools place zones mechanically without quality filtering, flooding the chart with dozens of marginal levels that have little predictive value. The IZM's four-component scoring system ensures only zones with meaningful institutional characteristics survive on the chart. A minimum strength filter removes everything below the user-defined threshold, and the mitigation system automatically removes, stops extending, or fades zones that have been closed through — maintaining a clean, current map of active supply and demand.

Core Concepts
1. Swing Pivot Detection
The indicator uses ta.pivothigh and ta.pivotlow with a configurable swing length. A pivot high confirmed at bar_index means a price high existed swingLen bars ago that was higher than the swingLen bars on either side of it. When a pivot low is confirmed, the indicator looks back through a configurable candle lookback window to find the last bearish close candle before that pivot — this is the bullish order block candidate. The displacement check ensures the move from that candle to the pivot was at least ATR * dispMult, filtering out low-momentum pivots that are unlikely to represent genuine institutional accumulation.
2. Four-Component Strength Scoring
Each zone receives a score between 0 and 10 from four additive components:
The minimum strength filter (default 3.0/10) removes zones that fail to meet the threshold, keeping the chart uncluttered.
3. Session Classification and Color-Coded Borders
Each zone's birth session is stored and used to color its border: London zones receive a blue border (#60a5fa), NY zones a pink border (#f472b6), Asia zones a green border (#34d399), and off-hours zones a gray border (#64748b). The session is detected from the candle's timestamp using UTC hours, mapping to standard London (08:00-17:00 UTC), New York (13:00-22:00 UTC), and Asia (00:00-09:00 UTC) windows. This allows traders to immediately gauge which market session was active when institutional activity was registered.
4. Mitigation Lifecycle
When price closes through a zone — below the bottom of a bull OB, or above the top of a bear OB — the zone is considered mitigated. Three mitigation behaviors are available:
Touch counting is separate from mitigation — each confirmed close inside the zone increments the touch count, and the border progressively darkens with each retest to communicate how many times price has interacted with the level.
5. Proximity Detection
A configurable ATR buffer defines a proximity zone above each bull OB and below each bear OB. When price enters this buffer without yet entering the zone, the dashboard shows "NEAR" and proximity diamonds appear on the chart. This gives an early warning that price is approaching an active level before the actual retest occurs.
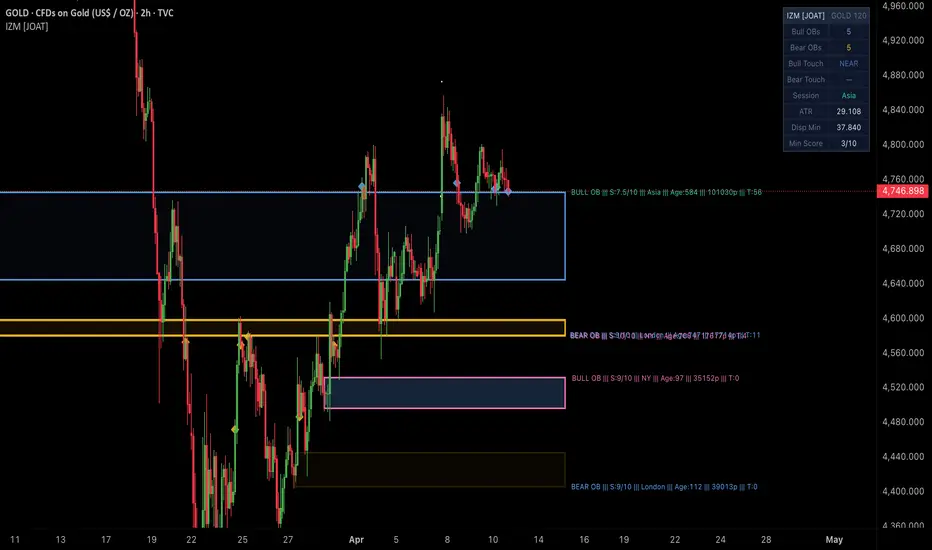
IZM showing the proximity diamond markers appearing as price approaches a bull OB from above, the info label updating with live age and touch count, and a faded zone after mitigation with the Stop Extending behavior active
Features
Input Parameters
Order Block Detection:
Zone Settings:
Mitigation:
How to Use This Indicator
Primary Setup — Zone Retest Entry:
Look for price returning to an active zone (box fill area) after displacement away from it. When the dashboard shows ACTIVE and the zone has a high strength score (7+), this represents a high-quality retest opportunity. Enter in the zone's direction with a stop beyond the opposite edge of the box.
Reading the Strength Score:
Zones scoring 7-10 should be treated as premium levels — the displacement was large, the session was active, the zone is fresh, and the height is optimal. Zones scoring 3-5 are marginal. Use the minimum filter to remove low-quality zones entirely if the chart becomes cluttered.
Session Context:
London and NY zones (blue and pink borders) represent the most liquid, highest-participation session activity. An Asia-born zone that has not been retested by London or NY open is lower priority. A NY-born zone returning to price during the following London session is a high-context setup.
Proximity Workflow:
When a proximity diamond appears, price is approaching but has not entered a zone. This is the time to prepare your entry plan — set alerts using the Approaching alerts, watch for confirmation signals on a lower timeframe, and be ready when the NEAR state transitions to ACTIVE.

Indicator Limitations
Originality Statement
This indicator is original in its four-component strength scoring system, session-colored border architecture, and touch-count border darkening feedback mechanism. The publication is justified because:
Disclaimer
This indicator is provided for educational and informational purposes only and does not constitute financial advice or a recommendation to buy or sell any financial instrument. Past performance of any pattern or signal does not guarantee future results. All trading involves substantial risk. Always use proper risk management and conduct your own independent analysis.
— Made with passion by officialjackofalltrades
Introduction
Institutional Zone Mapper [JOAT] is an open-source overlay indicator that detects swing-pivot order blocks — the last impulsive candle preceding a significant price displacement — and renders them as persistent box-based zones with session-color-coded borders, a four-component strength score from 0 to 10, touch-count tracking, and a configurable mitigation lifecycle. The indicator identifies the candle immediately before a confirmed swing pivot, verifies that a meaningful ATR-scaled displacement followed, and places a zone around that candle's midpoint. Zones are born with a strength score derived from displacement magnitude, session context, age, and zone height — allowing traders to instantly distinguish premium, high-conviction zones from weak, low-probability ones.
The core problem this indicator solves is that most order block tools place zones mechanically without quality filtering, flooding the chart with dozens of marginal levels that have little predictive value. The IZM's four-component scoring system ensures only zones with meaningful institutional characteristics survive on the chart. A minimum strength filter removes everything below the user-defined threshold, and the mitigation system automatically removes, stops extending, or fades zones that have been closed through — maintaining a clean, current map of active supply and demand.
Core Concepts
1. Swing Pivot Detection
The indicator uses ta.pivothigh and ta.pivotlow with a configurable swing length. A pivot high confirmed at bar_index means a price high existed swingLen bars ago that was higher than the swingLen bars on either side of it. When a pivot low is confirmed, the indicator looks back through a configurable candle lookback window to find the last bearish close candle before that pivot — this is the bullish order block candidate. The displacement check ensures the move from that candle to the pivot was at least ATR * dispMult, filtering out low-momentum pivots that are unlikely to represent genuine institutional accumulation.
2. Four-Component Strength Scoring
Each zone receives a score between 0 and 10 from four additive components:
- Displacement Score (0-3): The ratio of the displacement to ATR is binned — larger moves score higher, capped at 3.0
- Session Score (0-2): London and NY session zones score 2.0, Asia zones score 1.0, off-hours score 0.5
- Age Score (0-2): Freshly formed zones (under 30 bars) score 2.0; zones over 150 bars old score 0.5
- Zone Height Score (0-3): Zones whose ATR-normalized height falls in a sweet spot (0.5 to 2x ATR) score 3.0 — too tight or too wide zones score lower
The minimum strength filter (default 3.0/10) removes zones that fail to meet the threshold, keeping the chart uncluttered.
3. Session Classification and Color-Coded Borders
Each zone's birth session is stored and used to color its border: London zones receive a blue border (#60a5fa), NY zones a pink border (#f472b6), Asia zones a green border (#34d399), and off-hours zones a gray border (#64748b). The session is detected from the candle's timestamp using UTC hours, mapping to standard London (08:00-17:00 UTC), New York (13:00-22:00 UTC), and Asia (00:00-09:00 UTC) windows. This allows traders to immediately gauge which market session was active when institutional activity was registered.
4. Mitigation Lifecycle
When price closes through a zone — below the bottom of a bull OB, or above the top of a bear OB — the zone is considered mitigated. Three mitigation behaviors are available:
- Delete: Zone is removed entirely from the chart
- Stop Extending: Zone stops extending to the right and fades to near-transparent (zone box is fixed at the current bar)
- Keep: Zone remains but fades visually to indicate mitigation
Touch counting is separate from mitigation — each confirmed close inside the zone increments the touch count, and the border progressively darkens with each retest to communicate how many times price has interacted with the level.
5. Proximity Detection
A configurable ATR buffer defines a proximity zone above each bull OB and below each bear OB. When price enters this buffer without yet entering the zone, the dashboard shows "NEAR" and proximity diamonds appear on the chart. This gives an early warning that price is approaching an active level before the actual retest occurs.
IZM showing the proximity diamond markers appearing as price approaches a bull OB from above, the info label updating with live age and touch count, and a faded zone after mitigation with the Stop Extending behavior active
Features
- Swing Pivot Order Block Detection: Locates the last impulsive candle before a confirmed swing high or low with ATR-scaled displacement verification
- Four-Component Strength Score (0-10): Displacement, session, age, and zone height combine into a single quality score — only zones above the minimum threshold are displayed
- Session-Colored Borders: London blue / NY pink / Asia green / Off gray borders identify which session birthed each zone at a glance
- Box-Based Zone Rendering: Solid box fills with session-colored borders — substantially more visible than linefill-based zone systems
- Touch Count Darkening: Zone border opacity increases with each confirmed retest, visually communicating how frequently price has revisited the level
- Three Mitigation Behaviors: Keep, Stop Extending, or Delete — each with optional fade-on-mitigation toggle
- Proximity Markers and Dashboard State: Diamond markers and NEAR/ACTIVE dashboard state when price enters or approaches active zones
- Info Labels: Dynamic text labels at zone right edge showing type, strength score, session, age in bars, zone height in pips/ticks, and touch count
- Position Filter: Optional toggle to show only bull OBs below current price and bear OBs above, removing zones that are contextually irrelevant to the current price location
- Max Active OBs: Oldest zones are trimmed when the array exceeds the configured maximum, keeping memory usage bounded
- 9-Row Dashboard: Active bull/bear OB counts, touch states (ACTIVE / NEAR), current session, ATR, minimum displacement distance, minimum strength threshold
- 6 Alertconditions: Zone entry, proximity approach, and new zone creation alerts for both bull and bear sides
Input Parameters
Order Block Detection:
- Swing Length: Pivot confirmation lookback — higher values detect more significant, less frequent pivots (default 7)
- OB Candle Lookback: How many bars back to search for the qualifying order block candle (default 20)
- Displacement ATR Mult: Minimum displacement from OB candle to pivot, as a multiple of ATR (default 1.3)
- Max Active OBs / Side: Maximum concurrent zones per direction before oldest are trimmed (default 5)
- Min Strength Filter: Minimum strength score required to display a zone (default 3.0/10)
Zone Settings:
- Zone ATR Width: Half the zone height expressed as ATR multiplier — sets the vertical thickness of zones (default 0.75)
- Proximity Buffer (ATR): Distance above/below zone edge that activates the NEAR state (default 0.25)
- Position Filter: When enabled, only shows zones on the correct side of current price (default off)
Mitigation:
- On Mitigation: Keep / Stop Extending / Delete (default Stop Extending)
- Fade On Mitigation: Whether to reduce zone opacity when mitigated (default on)
How to Use This Indicator
Primary Setup — Zone Retest Entry:
Look for price returning to an active zone (box fill area) after displacement away from it. When the dashboard shows ACTIVE and the zone has a high strength score (7+), this represents a high-quality retest opportunity. Enter in the zone's direction with a stop beyond the opposite edge of the box.
Reading the Strength Score:
Zones scoring 7-10 should be treated as premium levels — the displacement was large, the session was active, the zone is fresh, and the height is optimal. Zones scoring 3-5 are marginal. Use the minimum filter to remove low-quality zones entirely if the chart becomes cluttered.
Session Context:
London and NY zones (blue and pink borders) represent the most liquid, highest-participation session activity. An Asia-born zone that has not been retested by London or NY open is lower priority. A NY-born zone returning to price during the following London session is a high-context setup.
Proximity Workflow:
When a proximity diamond appears, price is approaching but has not entered a zone. This is the time to prepare your entry plan — set alerts using the Approaching alerts, watch for confirmation signals on a lower timeframe, and be ready when the NEAR state transitions to ACTIVE.
Indicator Limitations
- Order block detection requires a confirmed swing pivot — pivot confirmation in Pine Script v6 is delayed by swingLen bars, meaning zones are created with a bar offset relative to the actual pivot price action
- The displacement check uses the current-bar ATR, not the ATR at the time the zone was created — on rapidly expanding volatility environments this can temporarily raise the displacement threshold and filter out recent zones
- The four-component scoring system uses static bin boundaries. Markets with unusually large or small ATR ranges may require tuning the displacement multiplier and zone width parameters to produce well-calibrated scores
- Touch count increments on any confirmed close inside the zone, including the candle that originally created it. The first touch is therefore always the creation bar itself; meaningful retest context begins at touch count 2+
- The mitigation logic detects a close through the zone edge, not an intrabar wick. Strong impulse candles that close back inside the zone will not trigger mitigation despite briefly penetrating the level
Originality Statement
This indicator is original in its four-component strength scoring system, session-colored border architecture, and touch-count border darkening feedback mechanism. The publication is justified because:
- The four-component strength score (displacement, session, age, zone height) produces a quantitative quality ranking that is not present in standard order block tools, allowing the user to immediately identify premium versus marginal zones without manual evaluation
- Session-colored borders encode institutional session context directly into the zone visual without requiring the user to maintain a separate session indicator, creating a self-contained contextual map
- Touch-count border darkening provides a progressive visual feedback loop that communicates zone interaction history — the darker the border, the more times price has revisited the level
- The proximity buffer and NEAR/ACTIVE dashboard state create a two-stage alert system that gives traders preparation time before an actual zone retest, reducing late entries
- The mitigation lifecycle with fade-on-mitigation is a novel approach to zone management that preserves chart history while clearly delineating which zones remain actionable
Disclaimer
This indicator is provided for educational and informational purposes only and does not constitute financial advice or a recommendation to buy or sell any financial instrument. Past performance of any pattern or signal does not guarantee future results. All trading involves substantial risk. Always use proper risk management and conduct your own independent analysis.
— Made with passion by officialjackofalltrades
Script de código abierto
Fiel al espíritu de TradingView, el creador de este script lo ha convertido en código abierto, para que los traders puedan revisar y verificar su funcionalidad. ¡Enhorabuena al autor! Aunque puede utilizarlo de forma gratuita, recuerde que cualquier republicación del código está sujeta a nuestras Normas internas.

The AI Trading Ecosystem, Built to win trades 📈
Get Full Access 👇
jackofalltrades.vip 🌐
t.me/jackofalltradesvip 🃏
Get Full Access 👇
jackofalltrades.vip 🌐
t.me/jackofalltradesvip 🃏
Exención de responsabilidad
La información y las publicaciones no constituyen, ni deben considerarse como, asesoramiento o recomendaciones financieras, de inversión, de trading u otro tipo, proporcionadas o respaldadas por TradingView. Obtenga más información en Condiciones de uso.
Script de código abierto
Fiel al espíritu de TradingView, el creador de este script lo ha convertido en código abierto, para que los traders puedan revisar y verificar su funcionalidad. ¡Enhorabuena al autor! Aunque puede utilizarlo de forma gratuita, recuerde que cualquier republicación del código está sujeta a nuestras Normas internas.
The AI Trading Ecosystem, Built to win trades 📈
Get Full Access 👇
jackofalltrades.vip 🌐
t.me/jackofalltradesvip 🃏
Get Full Access 👇
jackofalltrades.vip 🌐
t.me/jackofalltradesvip 🃏
Exención de responsabilidad
La información y las publicaciones no constituyen, ni deben considerarse como, asesoramiento o recomendaciones financieras, de inversión, de trading u otro tipo, proporcionadas o respaldadas por TradingView. Obtenga más información en Condiciones de uso.