OPEN-SOURCE SCRIPT
Actualizado Volume Absorption Zones [AGPro Series]
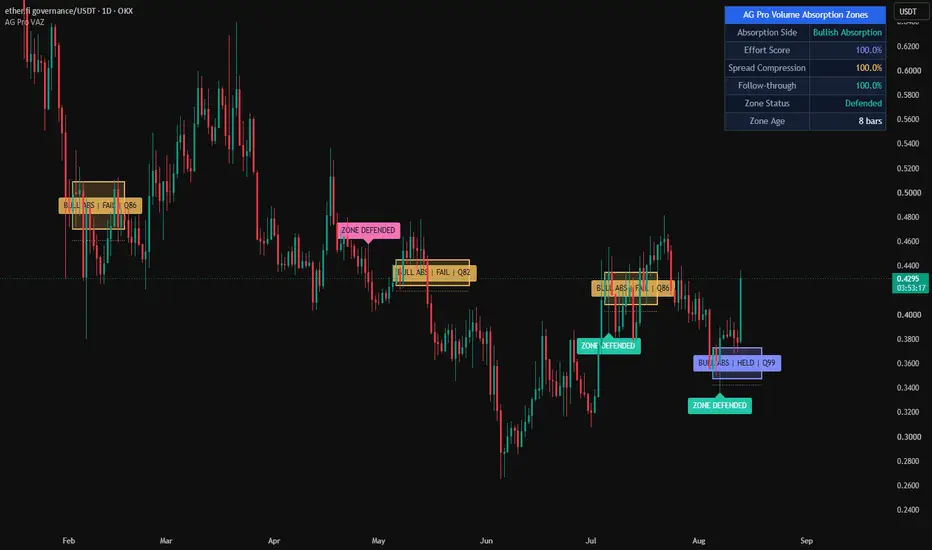
Volume Absorption Zones [AGPro Series]
🔷 Overview
Volume Absorption Zones [AGPro Series] is a chart-overlay volume analysis tool built around one specific market condition: high effort with limited price result.
Instead of marking every high-volume candle as important, the script looks for candles where participation expands while the candle range stays compressed, the close location shows directional control, and the resulting price area can be tracked as a forward absorption zone.
When a valid event appears, the script draws a rectangular bullish or bearish absorption box, projects it forward, adds an invalidation level, and continues monitoring whether the zone is defended, failed, or left as active context.
The goal is to make absorption visible as a lifecycle on the chart rather than a one-bar marker.
🔹 Core Idea
Absorption is not the same thing as a volume spike.
A volume spike can appear during expansion, exhaustion, liquidation, news reactions, or ordinary session activity. This script focuses on a narrower structure:
- Volume expands relative to its recent baseline.
- Candle spread remains compressed relative to its recent range baseline.
- The close location shows directional control.
- The wick/body structure leaves a usable absorption range.
- The zone remains visible after the event so later defense or failure can be evaluated.
Bullish absorption is modeled as high participation absorbed near the lower side of the candle while the close finishes with upper-side control.
Bearish absorption is modeled as high participation absorbed near the upper side of the candle while the close finishes with lower-side control.
This makes the script an effort-versus-result zone model, not a generic volume highlight.
💎 What Makes This Script Different
Most volume absorption scripts and high-volume tools stop at one of three outputs:
- A candle color.
- A triangle or label.
- A simple high-volume marker.
Volume Absorption Zones goes further by converting the detected event into a managed chart zone.
The script keeps asking questions after the first signal:
- Where is the absorption range?
- Is the zone still active?
- Has price defended the zone?
- Has price closed beyond the invalidation level?
- Is follow-through improving or fading?
- How old is the zone?
- Is the current context bullish absorption, bearish absorption, defended, failed, or mature?
This lifecycle approach is the main design difference. The first event creates the zone; the later candles tell the story.
🧭 Difference From Other AGPro Scripts
This script was designed to sit in a separate lane from existing AGPro volume and price-action tools.
It is not Volume Climax Detector.
Volume Climax Detector focuses on extreme participation and climax-style events. Volume Absorption Zones focuses on compressed effort: elevated volume with limited spread and a forward zone that can later defend or fail.
It is not Relative Volume Pressure Map.
Relative Volume Pressure Map classifies broader relative-volume pressure and pressure efficiency. Volume Absorption Zones does not try to build a broad pressure regime. It isolates concrete absorption ranges and follows their lifecycle.
It is not Volume Delta Imbalance Map.
Volume Delta Imbalance Map is built around flow imbalance behavior. Volume Absorption Zones does not estimate bid/ask delta, CVD, or directional transaction flow. It stays OHLCV-native and uses candle structure plus relative volume effort.
It is not Volume Profile Acceptance Ladder or a POC tool.
This script does not build volume profile bins, value area, POC magnets, acceptance ladders, or auction distribution zones. Its zones come only from absorption-candle conditions.
It is not a general support/resistance drawer.
The boxes are not swing highs, swing lows, pivots, order blocks, or manually projected support/resistance areas. A box appears only when the absorption engine detects high effort, compressed result, close-location control, and sufficient quality.
That separation is important: the script is not a renamed version of another AGPro concept. Its role is absorption-zone lifecycle tracking.
⚙️ How The Engine Works
The script evaluates each candle through a structured sequence:
1. Volume Effort
Current volume is compared with a rolling volume baseline. The event must show elevated participation before any absorption zone can be created.
2. Spread Compression
The candle range is compared with a recent spread baseline. A qualifying event needs limited price travel relative to normal range behavior.
3. Close Location
Bullish absorption requires the close to finish in the upper part of the candle. Bearish absorption requires the close to finish in the lower part of the candle.
4. Absorbed Wick Share
The script checks whether the candle leaves enough absorbed-side structure to define a useful zone.
5. Absorption Quality
Effort, compression, and close-location behavior are blended into a quality score. This helps filter weaker events and keeps the chart focused on stronger absorption structures.
6. Zone Projection
When the event qualifies, the script draws a rectangular zone and extends it forward for the selected number of bars.
7. Invalidation Level
Each zone receives an ATR-buffered invalidation line beyond the absorption range.
8. Defense / Failure Tracking
After the zone is created, the script tracks whether price defends the range or closes beyond invalidation.
📦 Zone States
Active
The zone has been created and remains unresolved.
Defended
Price interacts with the zone and closes back in favor of the zone direction.
Failed
Price closes beyond the ATR-buffered invalidation level.
Mature
The zone remains active beyond the selected age threshold.
These states help the user understand whether an absorption zone is still relevant, has been respected, or has lost its structure.
📊 AGPro Panel
The dashboard summarizes the latest absorption context without requiring the user to inspect every box manually.
Panel fields:
- Absorption Side
- Effort Score
- Spread Compression
- Follow-through
- Zone Status
- Zone Age
The panel follows the AGPro publication layout:
- Single merged blue header row.
- Header contains only the script panel title.
- Adjustable panel location.
- Adjustable panel theme.
- Adjustable panel font size.
🎯 Visual Design
The script is designed to be readable on clean publication charts:
- Bullish zones use the AGPro teal state color.
- Bearish zones use the AGPro pink state color.
- Failed zones shift to the neutral state color.
- Defended zones shift to the accent state color.
- Invalidation lines are dotted and subtle.
- Event labels are offset from candles so they remain visible.
- Label cooldown and maximum-label settings keep density under control.
- Active zone count is capped for performance and readability.
The default visual style is intentionally active, because absorption is easier to understand when the zone lifecycle is visible on the chart.
🔔 Alerts
Included alert conditions:
- Bullish Absorption Zone
- Bearish Absorption Zone
- Absorption Zone Defended
- Absorption Zone Failed
These alerts are tied to the same lifecycle states shown on the chart.
🛠 Key Inputs
Volume Baseline Length
Controls the lookback used to normalize current volume.
High Effort Threshold
Defines how much relative volume expansion is required before a candle can qualify.
Spread Baseline Length
Controls the range baseline used for spread compression.
Maximum Spread Ratio
Defines how compressed the candle must be relative to its baseline.
Strong Close Location
Controls how strongly the candle must close toward the active side.
Minimum Absorbed Wick Share
Requires visible absorbed-side candle structure before a zone can be accepted.
Minimum Absorption Quality
Filters events by the combined effort, compression, and close-location score.
Zone Extension Bars
Controls how far absorption boxes project forward.
Max Active Zones
Caps the number of active boxes retained on the chart.
Invalidation Buffer ATR
Controls the ATR buffer used for each zone's invalidation level.
Mature Zone Age
Defines when an unresolved zone is considered mature.
Max Zone Memory Bars
Removes older zones so the chart remains focused on recent, visible absorption context.
Label Cooldown Bars
Controls spacing between event labels.
Max Event Labels
Controls the maximum number of retained labels.
Label Font Size / Panel Font Size
Both default to Normal and can be adjusted from settings.
🧩 Best Use
Volume Absorption Zones is designed for traders who want to study:
- High-effort, low-result candles.
- Absorption zones that remain visible after the initial event.
- Whether later price action defends or fails those zones.
- Market areas where volume expands but price travel remains compressed.
- Weekly, daily, and intraday absorption structures without needing a lower-pane volume dashboard.
The script can be used across symbols and timeframes where TradingView volume data is available. The quality of results depends on the instrument, session structure, liquidity, and reliability of the volume feed.
🔍 Limitations & Transparency
This script uses standard TradingView OHLCV data.
It does not access order book data, bid/ask data, footprint data, true delta, or exchange-native transaction flow.
The absorption model is rule-based. It approximates absorption through relative volume effort, spread compression, close-location behavior, wick/body structure, and later zone interaction.
It does not predict future price movement and it does not issue buy or sell commands. It organizes absorption context on the chart so users can evaluate how price behaves around those zones.
Different instruments and timeframes may require input adjustments. Thin markets, irregular volume feeds, major gaps, and unusual sessions can affect event quality.
✅ Chart Reading Guide
For the clearest view, use a clean chart with only this script loaded. The boxes, labels, dotted invalidation lines, and panel are designed to explain the absorption lifecycle without requiring additional overlays.
🔷 Overview
Volume Absorption Zones [AGPro Series] is a chart-overlay volume analysis tool built around one specific market condition: high effort with limited price result.
Instead of marking every high-volume candle as important, the script looks for candles where participation expands while the candle range stays compressed, the close location shows directional control, and the resulting price area can be tracked as a forward absorption zone.
When a valid event appears, the script draws a rectangular bullish or bearish absorption box, projects it forward, adds an invalidation level, and continues monitoring whether the zone is defended, failed, or left as active context.
The goal is to make absorption visible as a lifecycle on the chart rather than a one-bar marker.
🔹 Core Idea
Absorption is not the same thing as a volume spike.
A volume spike can appear during expansion, exhaustion, liquidation, news reactions, or ordinary session activity. This script focuses on a narrower structure:
- Volume expands relative to its recent baseline.
- Candle spread remains compressed relative to its recent range baseline.
- The close location shows directional control.
- The wick/body structure leaves a usable absorption range.
- The zone remains visible after the event so later defense or failure can be evaluated.
Bullish absorption is modeled as high participation absorbed near the lower side of the candle while the close finishes with upper-side control.
Bearish absorption is modeled as high participation absorbed near the upper side of the candle while the close finishes with lower-side control.
This makes the script an effort-versus-result zone model, not a generic volume highlight.
💎 What Makes This Script Different
Most volume absorption scripts and high-volume tools stop at one of three outputs:
- A candle color.
- A triangle or label.
- A simple high-volume marker.
Volume Absorption Zones goes further by converting the detected event into a managed chart zone.
The script keeps asking questions after the first signal:
- Where is the absorption range?
- Is the zone still active?
- Has price defended the zone?
- Has price closed beyond the invalidation level?
- Is follow-through improving or fading?
- How old is the zone?
- Is the current context bullish absorption, bearish absorption, defended, failed, or mature?
This lifecycle approach is the main design difference. The first event creates the zone; the later candles tell the story.
🧭 Difference From Other AGPro Scripts
This script was designed to sit in a separate lane from existing AGPro volume and price-action tools.
It is not Volume Climax Detector.
Volume Climax Detector focuses on extreme participation and climax-style events. Volume Absorption Zones focuses on compressed effort: elevated volume with limited spread and a forward zone that can later defend or fail.
It is not Relative Volume Pressure Map.
Relative Volume Pressure Map classifies broader relative-volume pressure and pressure efficiency. Volume Absorption Zones does not try to build a broad pressure regime. It isolates concrete absorption ranges and follows their lifecycle.
It is not Volume Delta Imbalance Map.
Volume Delta Imbalance Map is built around flow imbalance behavior. Volume Absorption Zones does not estimate bid/ask delta, CVD, or directional transaction flow. It stays OHLCV-native and uses candle structure plus relative volume effort.
It is not Volume Profile Acceptance Ladder or a POC tool.
This script does not build volume profile bins, value area, POC magnets, acceptance ladders, or auction distribution zones. Its zones come only from absorption-candle conditions.
It is not a general support/resistance drawer.
The boxes are not swing highs, swing lows, pivots, order blocks, or manually projected support/resistance areas. A box appears only when the absorption engine detects high effort, compressed result, close-location control, and sufficient quality.
That separation is important: the script is not a renamed version of another AGPro concept. Its role is absorption-zone lifecycle tracking.
⚙️ How The Engine Works
The script evaluates each candle through a structured sequence:
1. Volume Effort
Current volume is compared with a rolling volume baseline. The event must show elevated participation before any absorption zone can be created.
2. Spread Compression
The candle range is compared with a recent spread baseline. A qualifying event needs limited price travel relative to normal range behavior.
3. Close Location
Bullish absorption requires the close to finish in the upper part of the candle. Bearish absorption requires the close to finish in the lower part of the candle.
4. Absorbed Wick Share
The script checks whether the candle leaves enough absorbed-side structure to define a useful zone.
5. Absorption Quality
Effort, compression, and close-location behavior are blended into a quality score. This helps filter weaker events and keeps the chart focused on stronger absorption structures.
6. Zone Projection
When the event qualifies, the script draws a rectangular zone and extends it forward for the selected number of bars.
7. Invalidation Level
Each zone receives an ATR-buffered invalidation line beyond the absorption range.
8. Defense / Failure Tracking
After the zone is created, the script tracks whether price defends the range or closes beyond invalidation.
📦 Zone States
Active
The zone has been created and remains unresolved.
Defended
Price interacts with the zone and closes back in favor of the zone direction.
Failed
Price closes beyond the ATR-buffered invalidation level.
Mature
The zone remains active beyond the selected age threshold.
These states help the user understand whether an absorption zone is still relevant, has been respected, or has lost its structure.
📊 AGPro Panel
The dashboard summarizes the latest absorption context without requiring the user to inspect every box manually.
Panel fields:
- Absorption Side
- Effort Score
- Spread Compression
- Follow-through
- Zone Status
- Zone Age
The panel follows the AGPro publication layout:
- Single merged blue header row.
- Header contains only the script panel title.
- Adjustable panel location.
- Adjustable panel theme.
- Adjustable panel font size.
🎯 Visual Design
The script is designed to be readable on clean publication charts:
- Bullish zones use the AGPro teal state color.
- Bearish zones use the AGPro pink state color.
- Failed zones shift to the neutral state color.
- Defended zones shift to the accent state color.
- Invalidation lines are dotted and subtle.
- Event labels are offset from candles so they remain visible.
- Label cooldown and maximum-label settings keep density under control.
- Active zone count is capped for performance and readability.
The default visual style is intentionally active, because absorption is easier to understand when the zone lifecycle is visible on the chart.
🔔 Alerts
Included alert conditions:
- Bullish Absorption Zone
- Bearish Absorption Zone
- Absorption Zone Defended
- Absorption Zone Failed
These alerts are tied to the same lifecycle states shown on the chart.
🛠 Key Inputs
Volume Baseline Length
Controls the lookback used to normalize current volume.
High Effort Threshold
Defines how much relative volume expansion is required before a candle can qualify.
Spread Baseline Length
Controls the range baseline used for spread compression.
Maximum Spread Ratio
Defines how compressed the candle must be relative to its baseline.
Strong Close Location
Controls how strongly the candle must close toward the active side.
Minimum Absorbed Wick Share
Requires visible absorbed-side candle structure before a zone can be accepted.
Minimum Absorption Quality
Filters events by the combined effort, compression, and close-location score.
Zone Extension Bars
Controls how far absorption boxes project forward.
Max Active Zones
Caps the number of active boxes retained on the chart.
Invalidation Buffer ATR
Controls the ATR buffer used for each zone's invalidation level.
Mature Zone Age
Defines when an unresolved zone is considered mature.
Max Zone Memory Bars
Removes older zones so the chart remains focused on recent, visible absorption context.
Label Cooldown Bars
Controls spacing between event labels.
Max Event Labels
Controls the maximum number of retained labels.
Label Font Size / Panel Font Size
Both default to Normal and can be adjusted from settings.
🧩 Best Use
Volume Absorption Zones is designed for traders who want to study:
- High-effort, low-result candles.
- Absorption zones that remain visible after the initial event.
- Whether later price action defends or fails those zones.
- Market areas where volume expands but price travel remains compressed.
- Weekly, daily, and intraday absorption structures without needing a lower-pane volume dashboard.
The script can be used across symbols and timeframes where TradingView volume data is available. The quality of results depends on the instrument, session structure, liquidity, and reliability of the volume feed.
🔍 Limitations & Transparency
This script uses standard TradingView OHLCV data.
It does not access order book data, bid/ask data, footprint data, true delta, or exchange-native transaction flow.
The absorption model is rule-based. It approximates absorption through relative volume effort, spread compression, close-location behavior, wick/body structure, and later zone interaction.
It does not predict future price movement and it does not issue buy or sell commands. It organizes absorption context on the chart so users can evaluate how price behaves around those zones.
Different instruments and timeframes may require input adjustments. Thin markets, irregular volume feeds, major gaps, and unusual sessions can affect event quality.
✅ Chart Reading Guide
For the clearest view, use a clean chart with only this script loaded. The boxes, labels, dotted invalidation lines, and panel are designed to explain the absorption lifecycle without requiring additional overlays.
Notas de prensa
🔧 UPDATE NOTES - V1.3This update focuses on hidden badge cleanup and cleaner zone-label presentation.
The core purpose of the script remains unchanged.
This release fixes a visual artifact where hidden older zone badges could still appear as small colored boxes on the chart.
This script continues to function as an analytical and visualization tool.
It does not attempt to predict price direction or provide guaranteed outcomes.
------------------------
What Changed
------------------------
• Fixed hidden zone badge artifacts.
Older zone badges that exceed the visible badge limit now become fully transparent instead of leaving small colored squares on the chart.
• Preserved the visible badge limit.
The most recent zone badges remain visible while older absorption boxes stay on the chart without text clutter.
• Preserved zone badge lanes.
Visible zone badges continue to use ATR-based spacing to reduce overlap.
• Preserved all analytical behavior.
Zone creation, invalidation, defense, failure, panel values, and alerts remain unchanged.
------------------------
Visual Improvements
------------------------
• Removed small leftover badge boxes from older hidden zones.
• Improved premium chart cleanliness while keeping active zone context visible.
• Maintained contrast-safe badge readability on dark and light chart backgrounds.
------------------------
Interface & Usability
------------------------
• No new settings were required.
• Existing Visible Zone Badges and Zone Badge Lane Spacing controls remain active.
• Existing label and panel font controls remain unchanged.
------------------------
Behavior Notes
------------------------
This update does not change the core analytical logic of the script.
The goal is to improve clarity and usability, not to introduce new predictive behavior.
Users should interpret outputs the same way as before, but with cleaner hidden badge behavior.
------------------------
Limitations Reminder
------------------------
The script remains a rule-based analytical tool.
Market conditions such as volatility, liquidity, and timeframe differences may affect how signals appear.
Outputs should always be interpreted within broader market context.
------------------------
Risk Reminder
------------------------
This script is for educational and analytical purposes only.
It does not provide financial advice or guaranteed trading outcomes.
Users remain responsible for their own decisions.
Notas de prensa
🔧 UPDATE NOTES - v1.5This update focuses on label contrast and event-label spacing.
The core purpose of the script remains unchanged. It still detects high-effort,
low-result price-volume events where elevated participation is absorbed inside a
compressed candle range, projects bullish and bearish absorption zones, and
tracks zone defense, failure, effort, compression, follow-through and age.
This script continues to function as an analytical and visualization tool.
It does not attempt to predict price direction or provide guaranteed outcomes.
------------------------
What Changed
------------------------
• Contrast-aware label and badge text
Zone center badges, event labels (Zone Failure, Zone Defense, Bull/Bear
Absorption) and the panel header now derive their text color from each
element's background luminance. Previously a fixed light text read faintly on
the amber (failed / failure) and indigo (defended) backgrounds; these now read
crisply.
• Non-overlapping event labels
Failure, defense and absorption labels now check against recent labels and shift
vertically when several land close together. The label cooldown alone left some
stacking on busy or compressed views; labels now step apart cleanly while
keeping the existing spacing and retention limits.
• Removed the duplicate absorption label
Each absorption zone previously printed both a candle-side "BULL/BEAR ABS Q"
label and a centered zone badge carrying the same information. The redundant
candle-side label was removed; the centered badge already shows side, status
and quality ("BULL ABS | ACTIVE | Q ..."), and the zone box edge plus the
colored absorption bar still mark exactly where the zone formed. This is the
main reduction in on-chart crowding, especially on lower timeframes where many
zones cluster.
------------------------
Visual Improvements
------------------------
• Higher-contrast zone badges and event labels.
• Removed the duplicate absorption label so each zone is named once.
• Eliminated event-label stacking on busy and compressed views.
------------------------
Interface & Usability
------------------------
• The panel (Absorption Side, Effort Score, Spread Compression, Follow-through,
Zone Status, Zone Age) is unchanged in layout and content.
• Zone boxes, invalidation lines, zone-badge lane spacing and alerts are
unchanged.
------------------------
Behavior Notes
------------------------
This update does not change any absorption-detection, scoring, zone-lifecycle,
defense, failure or alert logic. Only label text color, the on-chart vertical
placement of event labels, and the removal of the duplicate absorption label
were adjusted. The number and meaning of zones and events is unchanged; each
zone is simply named once (via its centered badge) instead of twice.
Interpretation of all outputs is the same as before.
------------------------
Limitations Reminder
------------------------
The script remains a rule-based analytical tool. Market conditions such as
volatility, liquidity, volume quality and timeframe differences may affect how
absorption zones and their status appear. Outputs should always be interpreted
within broader market context.
------------------------
Risk Reminder
------------------------
This script is for educational and analytical purposes only. It does not provide
financial advice or guaranteed trading outcomes. Users remain responsible for
their own decisions.
Notas de prensa
Version 1.8 - Continuous Superposition GuardThis update removes badge collisions that could emerge after zone creation while preserving the complete V1.7 absorption engine, scoring, finite zone lifecycle, panel values, and four alert conditions.
• Collision evaluation now runs on every bar from the current geometry of all visible zone boxes instead of running only when a new footprint is created.
• Each older visible badge is compared with every newer visible badge, and the newer footprint owns the cluster whenever both protected dimensions overlap.
• Normal-font protection increased from 24 to 48 bars horizontally and from 1.00 to 1.80 ATR vertically, with proportional Tiny, Small, and Large thresholds.
• Reverse-order curation keeps array deletion index-safe and atomically removes the older box, invalidation line, center badge, lifecycle state, and analytical metadata.
• Center badge states were shortened to LIVE, HELD, FAIL, and AGED, reducing badge width while the panel retains the full Active, Defended, Failed, and Mature wording.
• Exact geometric centering, five-zone maximum history, disabled default event badges, 12-bar resolved tails, and optional event connector cleanup remain unchanged.
Script de código abierto
Fiel al espíritu de TradingView, el creador de este script lo ha convertido en código abierto, para que los traders puedan revisar y verificar su funcionalidad. ¡Enhorabuena al autor! Aunque puede utilizarlo de forma gratuita, recuerde que cualquier republicación del código está sujeta a nuestras Normas internas.

Trading Suite | Flagship Workflow :
tradingview.com/script/XJmX3p98-Trading-Suite-AGPro-Series/
Crypto Setup Planner | Multi-Symbol Analysis :
tradingview.com/script/LgVRo7Ql-Crypto-Setup-Planner-AGPro-Series/
tradingview.com/script/XJmX3p98-Trading-Suite-AGPro-Series/
Crypto Setup Planner | Multi-Symbol Analysis :
tradingview.com/script/LgVRo7Ql-Crypto-Setup-Planner-AGPro-Series/
Exención de responsabilidad
La información y las publicaciones no constituyen, ni deben considerarse como, asesoramiento o recomendaciones financieras, de inversión, de trading u otro tipo, proporcionadas o respaldadas por TradingView. Obtenga más información en Condiciones de uso.
Script de código abierto
Fiel al espíritu de TradingView, el creador de este script lo ha convertido en código abierto, para que los traders puedan revisar y verificar su funcionalidad. ¡Enhorabuena al autor! Aunque puede utilizarlo de forma gratuita, recuerde que cualquier republicación del código está sujeta a nuestras Normas internas.
Trading Suite | Flagship Workflow :
tradingview.com/script/XJmX3p98-Trading-Suite-AGPro-Series/
Crypto Setup Planner | Multi-Symbol Analysis :
tradingview.com/script/LgVRo7Ql-Crypto-Setup-Planner-AGPro-Series/
tradingview.com/script/XJmX3p98-Trading-Suite-AGPro-Series/
Crypto Setup Planner | Multi-Symbol Analysis :
tradingview.com/script/LgVRo7Ql-Crypto-Setup-Planner-AGPro-Series/
Exención de responsabilidad
La información y las publicaciones no constituyen, ni deben considerarse como, asesoramiento o recomendaciones financieras, de inversión, de trading u otro tipo, proporcionadas o respaldadas por TradingView. Obtenga más información en Condiciones de uso.