Reversal Radar X | jjart
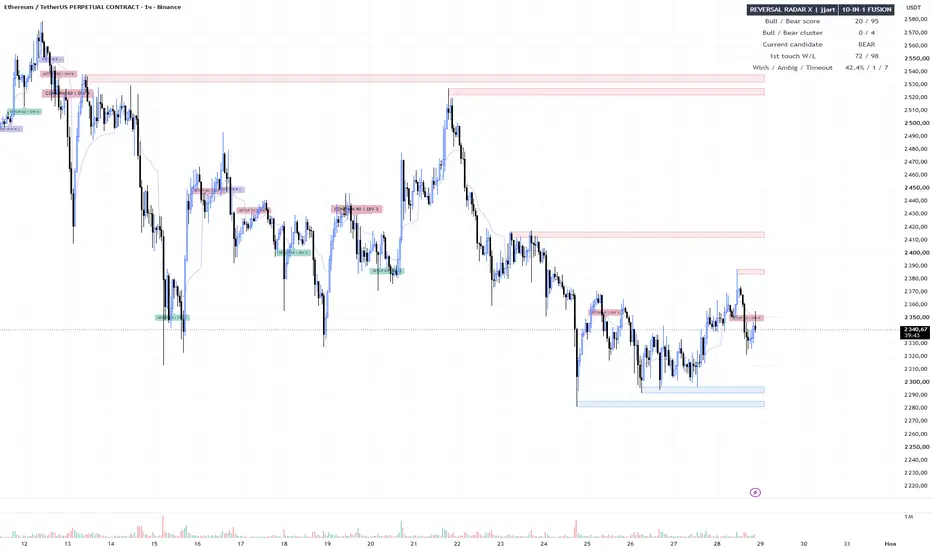
REVERSAL RADAR X | 10-IN-1 DIVERGENCE, REVERSAL & VOLUME INTELLIGENCE [jjart]
Reversal Radar X is a multi-factor price-action indicator built to identify potential reversal setups without filling the chart with repetitive signals. It combines eight divergence methods, candlestick patterns, liquidity sweeps, volume-based clues, market regime filters, adaptive support and resistance, and optional previous-session value levels.
Rather than treating every oscillator signal as an entry, the indicator groups evidence into a bullish or bearish quality score and distinguishes an emerging SETUP from a later CONFIRM event.
KEY FEATURES
1. EIGHT-METHOD DIVERGENCE CLUSTERS
Checks regular and hidden divergences using RSI, MACD Histogram, CCI, Stochastic, Money Flow Index (MFI), On-Balance Volume (OBV), Rate of Change (ROC), and Chaikin Money Flow (CMF).
A single compact label, such as DIV 3/8 or DIV 5/8, reports how many enabled methods agree around the same confirmed price pivot. R indicates regular divergence; H indicates hidden divergence. The eight methods are correlated and should not be interpreted as eight independent confirmations.
2. REVERSAL CANDLE PATTERNS
Detects pin-bar-style rejection candles, bullish and bearish engulfing patterns, and three-candle star-style reversal formations. These patterns contribute to setup context rather than generating automatic trades on their own.
3. LIQUIDITY SWEEP DETECTION
Looks for price temporarily crossing a previous local high or low and then closing back inside the prior range. Potential liquidity traps are considered alongside momentum and structural evidence.
4. VOLUME CLIMAX AND ABSORPTION PROXIES
Uses relative candle volume and rejection behavior to highlight potential high-activity turning points. These are price-and-volume proxies; they do not prove institutional absorption or reveal actual order flow.
5. MARKET STRUCTURE AND VWAP CONFIRMATION
Recent local range breaks and session VWAP reclaim events can provide additional directional confirmation. VWAP visualization is optional.
6. ADAPTIVE SUPPORT & RESISTANCE ZONES
Draws ATR-sized support and resistance zones around confirmed swing pivots. Nearby same-side zones can be merged, and broken or aged zones are removed to keep the chart readable. Pivot zones are only known after the selected right-side confirmation bars.
7. OPTIONAL PREVIOUS-SESSION VALUE MAP
Displays estimated previous-day POC, Value Area High (VAH), and Value Area Low (VAL). These levels are calculated approximately from chart-bar prices and volume. They are not an exact exchange volume profile, footprint, or a futures-sourced tick-by-tick calculation. The module is disabled by default.
8. MARKET REGIME AND HIGHER-TIMEFRAME CONTEXT
Uses EMA direction, ADX and a confirmed higher-timeframe trend reference to reduce the weight of weaker countertrend hypotheses. Strong trend conditions can lower reversal scores.
9. SETUP / CONFIRM QUALITY ENGINE
A configurable 0–100 heuristic score combines divergence clusters, price action, liquidity, volume and context. SETUP identifies an emerging candidate; CONFIRM requires stronger evidence and a recent directional trigger. Cooldowns and expiration rules help minimize repeated labels.
The score is an evidence-ranking tool, not a statistical probability of a reversal or a guaranteed win rate.
10. RESEARCH AND RISK CONTEXT
Optional invalidation and ATR-based target guide lines help visualize where an active hypothesis may fail. A compact dashboard includes first-touch outcome research: whether a predefined favorable ATR level or an adverse ATR level was reached first within a chosen number of bars. Ambiguous candles and timeouts are tracked separately.
This research counter is not a trading strategy backtest. It does not model commissions, slippage or execution.
HOW TO USE
For potential bullish reversals, look for a bullish divergence cluster near support, a liquidity sweep or rejection pattern, and then a directional confirmation. For bearish reversals, apply the opposite logic near resistance.
Start with the default minimum of three agreeing divergences and evaluate how SETUP and CONFIRM behave on your market and timeframe. Raising score thresholds or divergence requirements reduces the number of signals but does not automatically improve profitability.
VISUAL DESIGN
The indicator uses a restrained pastel palette, compact on-chart labels, configurable display options and explicit cleanup rules. All settings and descriptions are written in English.
IMPORTANT LIMITATIONS
Divergences and support/resistance zones depend on confirmed pivots and can appear only after the required confirmation bars. The indicator cannot predict the future. Technical signals can fail, especially in fast or strongly trending markets. Volume-dependent features require suitable volume data from the chart source.
This is a discretionary analysis tool, not an automated trading system or investment advice. No historical profitability, accuracy or live performance claim is made. Always validate signals independently and manage risk.
Created by jjart.
Reversal Radar X is a multi-factor price-action indicator built to identify potential reversal setups without filling the chart with repetitive signals. It combines eight divergence methods, candlestick patterns, liquidity sweeps, volume-based clues, market regime filters, adaptive support and resistance, and optional previous-session value levels.
Rather than treating every oscillator signal as an entry, the indicator groups evidence into a bullish or bearish quality score and distinguishes an emerging SETUP from a later CONFIRM event.
KEY FEATURES
1. EIGHT-METHOD DIVERGENCE CLUSTERS
Checks regular and hidden divergences using RSI, MACD Histogram, CCI, Stochastic, Money Flow Index (MFI), On-Balance Volume (OBV), Rate of Change (ROC), and Chaikin Money Flow (CMF).
A single compact label, such as DIV 3/8 or DIV 5/8, reports how many enabled methods agree around the same confirmed price pivot. R indicates regular divergence; H indicates hidden divergence. The eight methods are correlated and should not be interpreted as eight independent confirmations.
2. REVERSAL CANDLE PATTERNS
Detects pin-bar-style rejection candles, bullish and bearish engulfing patterns, and three-candle star-style reversal formations. These patterns contribute to setup context rather than generating automatic trades on their own.
3. LIQUIDITY SWEEP DETECTION
Looks for price temporarily crossing a previous local high or low and then closing back inside the prior range. Potential liquidity traps are considered alongside momentum and structural evidence.
4. VOLUME CLIMAX AND ABSORPTION PROXIES
Uses relative candle volume and rejection behavior to highlight potential high-activity turning points. These are price-and-volume proxies; they do not prove institutional absorption or reveal actual order flow.
5. MARKET STRUCTURE AND VWAP CONFIRMATION
Recent local range breaks and session VWAP reclaim events can provide additional directional confirmation. VWAP visualization is optional.
6. ADAPTIVE SUPPORT & RESISTANCE ZONES
Draws ATR-sized support and resistance zones around confirmed swing pivots. Nearby same-side zones can be merged, and broken or aged zones are removed to keep the chart readable. Pivot zones are only known after the selected right-side confirmation bars.
7. OPTIONAL PREVIOUS-SESSION VALUE MAP
Displays estimated previous-day POC, Value Area High (VAH), and Value Area Low (VAL). These levels are calculated approximately from chart-bar prices and volume. They are not an exact exchange volume profile, footprint, or a futures-sourced tick-by-tick calculation. The module is disabled by default.
8. MARKET REGIME AND HIGHER-TIMEFRAME CONTEXT
Uses EMA direction, ADX and a confirmed higher-timeframe trend reference to reduce the weight of weaker countertrend hypotheses. Strong trend conditions can lower reversal scores.
9. SETUP / CONFIRM QUALITY ENGINE
A configurable 0–100 heuristic score combines divergence clusters, price action, liquidity, volume and context. SETUP identifies an emerging candidate; CONFIRM requires stronger evidence and a recent directional trigger. Cooldowns and expiration rules help minimize repeated labels.
The score is an evidence-ranking tool, not a statistical probability of a reversal or a guaranteed win rate.
10. RESEARCH AND RISK CONTEXT
Optional invalidation and ATR-based target guide lines help visualize where an active hypothesis may fail. A compact dashboard includes first-touch outcome research: whether a predefined favorable ATR level or an adverse ATR level was reached first within a chosen number of bars. Ambiguous candles and timeouts are tracked separately.
This research counter is not a trading strategy backtest. It does not model commissions, slippage or execution.
HOW TO USE
For potential bullish reversals, look for a bullish divergence cluster near support, a liquidity sweep or rejection pattern, and then a directional confirmation. For bearish reversals, apply the opposite logic near resistance.
Start with the default minimum of three agreeing divergences and evaluate how SETUP and CONFIRM behave on your market and timeframe. Raising score thresholds or divergence requirements reduces the number of signals but does not automatically improve profitability.
VISUAL DESIGN
The indicator uses a restrained pastel palette, compact on-chart labels, configurable display options and explicit cleanup rules. All settings and descriptions are written in English.
IMPORTANT LIMITATIONS
Divergences and support/resistance zones depend on confirmed pivots and can appear only after the required confirmation bars. The indicator cannot predict the future. Technical signals can fail, especially in fast or strongly trending markets. Volume-dependent features require suitable volume data from the chart source.
This is a discretionary analysis tool, not an automated trading system or investment advice. No historical profitability, accuracy or live performance claim is made. Always validate signals independently and manage risk.
Created by jjart.

Exención de responsabilidad
La información y las publicaciones no constituyen, ni deben considerarse como, asesoramiento o recomendaciones financieras, de inversión, de trading u otro tipo, proporcionadas o respaldadas por TradingView. Obtenga más información en Condiciones de uso.
Exención de responsabilidad
La información y las publicaciones no constituyen, ni deben considerarse como, asesoramiento o recomendaciones financieras, de inversión, de trading u otro tipo, proporcionadas o respaldadas por TradingView. Obtenga más información en Condiciones de uso.