Actualizado
Double ROC (Acceleration) by Ocean Drive
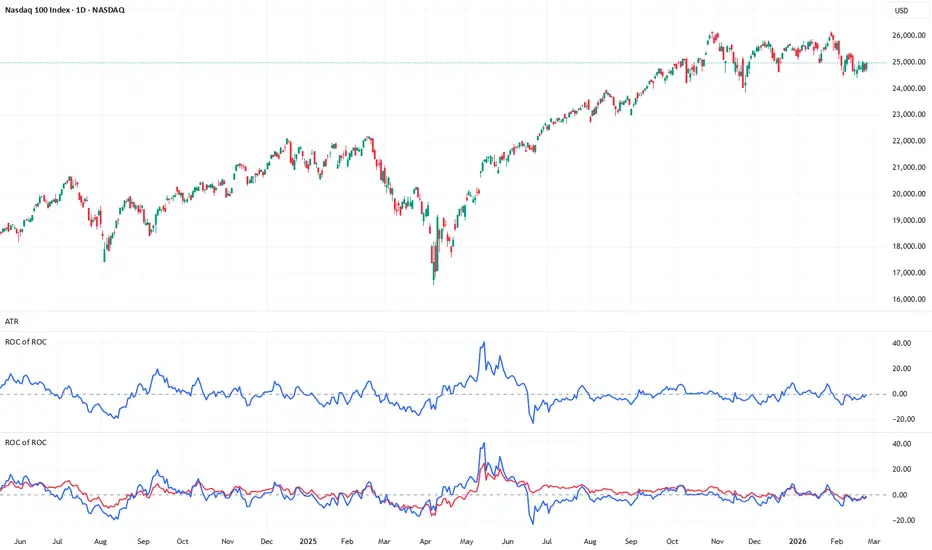
Overview
The Double ROC (Rate of Change) is a second-derivative momentum indicator designed to measure the acceleration and deceleration of price trends. While a standard ROC measures the velocity of price (first derivative), this indicator measures the velocity of the ROC itself, effectively plotting the acceleration (second derivative).
Mathematical Logic & Design
A common structural flaw when building an "ROC of ROC" is applying a standard percentage change formula to the first ROC. Because the inner ROC is an oscillator that crosses the zero line, this approach inevitably leads to severe mathematical distortions and divide-by-zero errors.
To solve this, this script calculates the absolute momentum (ta.change) of the Inner ROC over the Outer ROC lookback period. This ensures a mathematically stable and accurate reading of momentum acceleration without extreme outlier spikes.
How to Read and Apply
Zero Line Crossings: A cross above the zero line indicates that upward momentum is accelerating. A cross below the zero line indicates that downward momentum is accelerating.
Divergence: This is a leading indicator for structural shifts. If the price makes a higher high but the Double ROC makes a lower high, the prevailing uptrend is losing momentum (decelerating) and a reversal may be imminent.
Trend Exhaustion: Extreme peaks or troughs in the indicator often align with intermediate-term or macroeconomic inflection points, signaling that the current price velocity is unsustainable.
Inputs
Inner ROC Length (Momentum): The lookback period for the base price velocity. (Default: 25)
Outer ROC Length (Acceleration): The lookback period used to measure the acceleration of the Inner ROC. (Default: 25)
Source: The price data used for calculation. (Default: Close)
The Double ROC (Rate of Change) is a second-derivative momentum indicator designed to measure the acceleration and deceleration of price trends. While a standard ROC measures the velocity of price (first derivative), this indicator measures the velocity of the ROC itself, effectively plotting the acceleration (second derivative).
Mathematical Logic & Design
A common structural flaw when building an "ROC of ROC" is applying a standard percentage change formula to the first ROC. Because the inner ROC is an oscillator that crosses the zero line, this approach inevitably leads to severe mathematical distortions and divide-by-zero errors.
To solve this, this script calculates the absolute momentum (ta.change) of the Inner ROC over the Outer ROC lookback period. This ensures a mathematically stable and accurate reading of momentum acceleration without extreme outlier spikes.
How to Read and Apply
Zero Line Crossings: A cross above the zero line indicates that upward momentum is accelerating. A cross below the zero line indicates that downward momentum is accelerating.
Divergence: This is a leading indicator for structural shifts. If the price makes a higher high but the Double ROC makes a lower high, the prevailing uptrend is losing momentum (decelerating) and a reversal may be imminent.
Trend Exhaustion: Extreme peaks or troughs in the indicator often align with intermediate-term or macroeconomic inflection points, signaling that the current price velocity is unsustainable.
Inputs
Inner ROC Length (Momentum): The lookback period for the base price velocity. (Default: 25)
Outer ROC Length (Acceleration): The lookback period used to measure the acceleration of the Inner ROC. (Default: 25)
Source: The price data used for calculation. (Default: Close)
Notas de prensa
Update NotesAdded the Inner ROC plot to the indicator. You can now monitor both the primary momentum (velocity) and the secondary momentum (acceleration) simultaneously in a single pane for better context.
Overview
The Double ROC (Rate of Change) indicator tracks both the intermediate-term momentum of price (Inner ROC) and its acceleration (Outer ROC). By displaying both lines, it provides a comprehensive view of trend velocity and its underlying strength, making it easier to identify structural shifts in the market.
Mathematical Logic & Design
A common structural flaw when building an "ROC of ROC" is applying a standard percentage change formula to the first ROC. Because the inner ROC is an oscillator that crosses the zero line, this approach inevitably leads to severe mathematical distortions and divide-by-zero errors.
To solve this, the Outer ROC (acceleration) is calculated using the absolute momentum (ta.change) of the Inner ROC. This ensures a mathematically stable reading.
How to Read and Apply
Inner ROC (Velocity): Represents the standard price momentum. Crosses above or below the zero line indicate primary bullish or bearish momentum shifts.
Outer ROC (Acceleration): Represents the acceleration of the momentum. A cross above the zero line means the current momentum (whether up or down) is accelerating. A cross below means it is decelerating.
Divergence: If the price makes a higher high but the indicator lines (especially the Outer ROC) make a lower high, the prevailing trend is losing its driving force and a reversal may be imminent.
Inputs
Inner ROC Length (Momentum): The lookback period for the base price velocity. (Default: 25)
Outer ROC Length (Acceleration): The lookback period used to measure the acceleration of the Inner ROC. (Default: 25)
Source: The price data used for calculation. (Default: Close)

Exención de responsabilidad
La información y las publicaciones no constituyen, ni deben considerarse como, asesoramiento o recomendaciones financieras, de inversión, de trading u otro tipo, proporcionadas o respaldadas por TradingView. Obtenga más información en Condiciones de uso.
Exención de responsabilidad
La información y las publicaciones no constituyen, ni deben considerarse como, asesoramiento o recomendaciones financieras, de inversión, de trading u otro tipo, proporcionadas o respaldadas por TradingView. Obtenga más información en Condiciones de uso.