Relative Strength Rotation [Gabremoku]
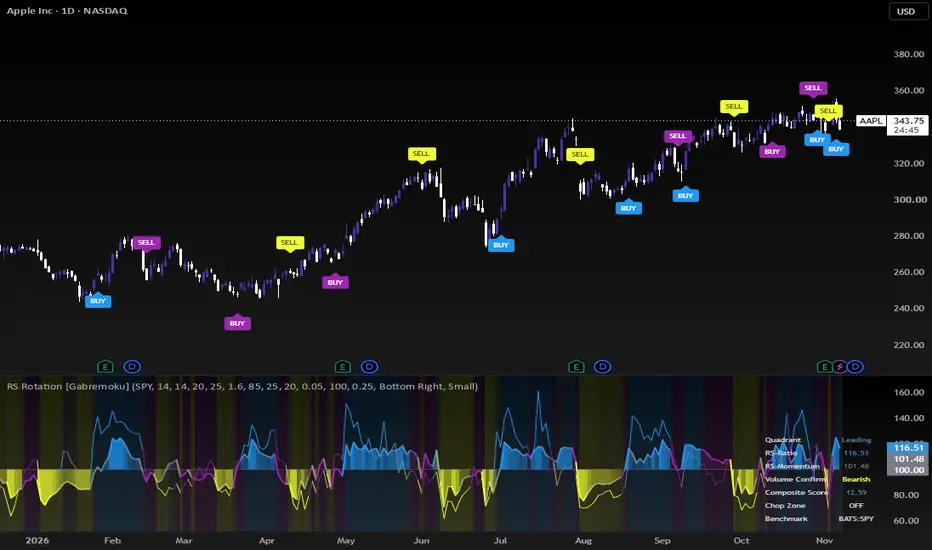
Relative Strength Rotation [Gabremoku] shows whether a symbol is gaining or losing strength against a benchmark (SPY by default) and whether the symbol's own volume backs that move.
How relative strength is measured
The four quadrants
Until the benchmark has enough history on the chart, both lines stay empty and the dashboard reads "No Data". No quadrant and no signal is shown on a reading that cannot be computed.
Why volume is part of it
A rotation into Leading carries more weight when the symbol is being accumulated. To measure that, the script uses Chaikin Money Flow on the symbol itself. The composite score is the sum of the distances of RS-Ratio and RS-Momentum from 100, multiplied by 1.2 when CMF points the same way as the rotation and by 0.7 when it points against it. On symbols without volume data the multiplier stays at 1 and the dashboard reads "No Volume".
Chop zone
The script measures how far the (RS-Ratio, RS-Momentum) point sits from the 100/100 center and ranks that distance against the last 100 bars with a percentile rank. When it falls in the lowest 25%, the rotation is too weak to mean much and the colors switch to purple. A percentile rank is used instead of min-max scaling because a single isolated spike in the history would squash every other reading toward zero.
What you see on the chart
How to use it
It is meant for choosing what to hold within a group of symbols, not for trading in and out on every bar. A symbol moving from Improving to Leading with volume on its side deserves attention. One in Weakening with negative CMF is losing drive before it shows in price. Pick the benchmark according to the comparison you want: SPY for US stocks, a sector ETF to compare a stock with its sector, BTC for altcoins.
Limits
This is a relative measure: a symbol can be Leading while it falls, if the benchmark falls more. In sideways markets the quadrants change often, which is why the chop zone exists. Signals are not a guarantee of any result.
How relative strength is measured
- RS-Ratio: the chart price is divided by the benchmark price. The script takes a z-score of that ratio over the last 14 bars and rescales it around 100. Above 100 the symbol is outperforming its own recent relative average; below 100 it is underperforming.
- RS-Momentum: the percentage change of RS-Ratio over the last 14 bars, also centered on 100. It tells you whether relative strength is accelerating or fading.
The four quadrants
- Leading: RS-Ratio and RS-Momentum both above 100.
- Weakening: relative strength still above 100, but momentum has dropped below.
- Lagging: both below 100.
- Improving: still weak, but momentum is back above 100.
Until the benchmark has enough history on the chart, both lines stay empty and the dashboard reads "No Data". No quadrant and no signal is shown on a reading that cannot be computed.
Why volume is part of it
A rotation into Leading carries more weight when the symbol is being accumulated. To measure that, the script uses Chaikin Money Flow on the symbol itself. The composite score is the sum of the distances of RS-Ratio and RS-Momentum from 100, multiplied by 1.2 when CMF points the same way as the rotation and by 0.7 when it points against it. On symbols without volume data the multiplier stays at 1 and the dashboard reads "No Volume".
Chop zone
The script measures how far the (RS-Ratio, RS-Momentum) point sits from the 100/100 center and ranks that distance against the last 100 bars with a percentile rank. When it falls in the lowest 25%, the rotation is too weak to mean much and the colors switch to purple. A percentile rank is used instead of min-max scaling because a single isolated spike in the history would squash every other reading toward zero.
What you see on the chart
- The RS-Ratio line, with a fill toward 100 that gets stronger as it moves away.
- The RS-Momentum line, thinner.
- A background colored by the composite score.
- BUY when the symbol enters Leading and SELL when it enters Lagging, alternating: after a BUY the next signal can only be a SELL. Signals inside the chop zone are drawn in purple.
- A dashboard with quadrant, values, volume confirmation, score, chop state and benchmark status.
- Four alerts, one for entering each quadrant.
How to use it
It is meant for choosing what to hold within a group of symbols, not for trading in and out on every bar. A symbol moving from Improving to Leading with volume on its side deserves attention. One in Weakening with negative CMF is losing drive before it shows in price. Pick the benchmark according to the comparison you want: SPY for US stocks, a sector ETF to compare a stock with its sector, BTC for altcoins.
Limits
This is a relative measure: a symbol can be Leading while it falls, if the benchmark falls more. In sideways markets the quadrants change often, which is why the chop zone exists. Signals are not a guarantee of any result.

Exención de responsabilidad
La información y las publicaciones no constituyen, ni deben considerarse como, asesoramiento o recomendaciones financieras, de inversión, de trading u otro tipo, proporcionadas o respaldadas por TradingView. Obtenga más información en Condiciones de uso.
Exención de responsabilidad
La información y las publicaciones no constituyen, ni deben considerarse como, asesoramiento o recomendaciones financieras, de inversión, de trading u otro tipo, proporcionadas o respaldadas por TradingView. Obtenga más información en Condiciones de uso.