OPEN-SOURCE SCRIPT
Velox Structure Ribbon [JOAT]
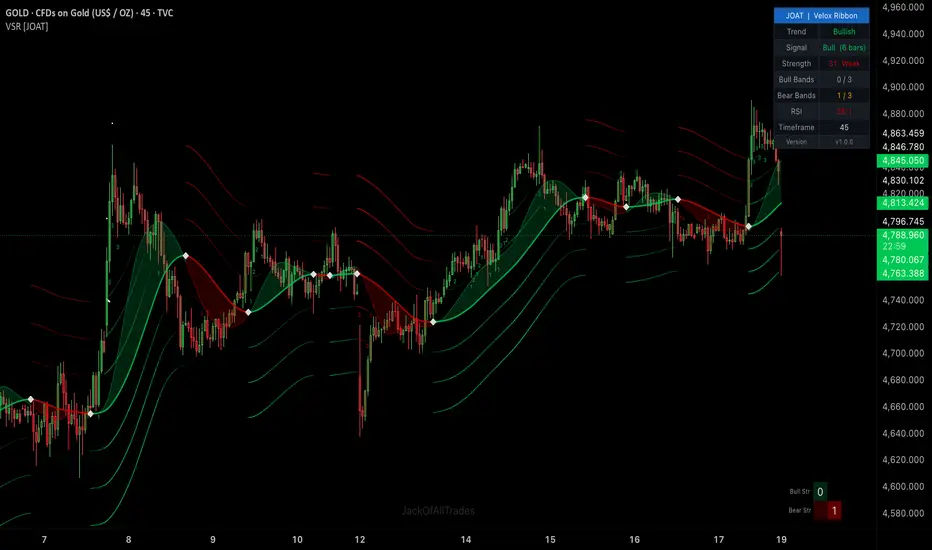
Velox Structure Ribbon [JOAT]
Introduction
Velox Structure Ribbon (VSR) is an open-source multi-band trend structure ribbon that uses a volatility-normalized, dynamically-spaced band system to visualize how far price has extended from its trend baseline and in which direction. The ribbon is anchored by a dual SMEMA core — a fast and slow double-smoothed moving average — and radiates six equidistant bands above and below the baseline, with spacing determined by the smoothed average candle range. Each band that price has penetrated adds one point to a 0-3 bull or bear structure score. A 0-100 composite trend strength score combines band penetration with RSI momentum. Volume confirmation and RSI filters are available to sharpen signal quality.
The problem VSR solves is that standard envelopes and Bollinger Bands use fixed or volatility-scaled offsets that can cluster bands too tightly in low-volatility environments and spread them too far in high-volatility ones. VSR normalizes band spacing using the market's own smoothed candle range, meaning band width automatically contracts in quiet markets and expands in active ones. This keeps the structure score meaningful across all conditions: three bands penetrated in a quiet market represents the same degree of extension relative to current volatility as three bands penetrated in a volatile market.

Core Concepts
1. SMEMA Ribbon Core
The ribbon center uses two SMEMA lines — slow (full period, default 20) and fast (half period). The slow SMEMA defines trend direction: sloping upward means the trend is bullish, downward means bearish. The fill between fast and slow creates a visual ribbon that contracts during consolidation and expands during trends:
Pine Script®
2. Volatility-Normalized Band Spacing
The step unit for band placement is SMEMA applied to the high-low range over a long smoothing period (default 100 bars). This produces an adaptive measure of the average candle body size. Each of the six bands is placed at integer multiples of this step above and below the slow SMEMA:
Pine Script®
Because the step automatically adjusts to market volatility, the bands always represent meaningful structural extensions rather than arbitrary percentage offsets.
3. Bull and Bear Structure Scoring
Each bar, the indicator counts how many upper bands price has broken through (bullish penetration) and how many lower bands (bearish penetration). Each penetrated band adds one point to the respective score:
Pine Script®
A score of 0 means price is between the baseline and first band — neutral zone. Score of 1 means first structural extension. Score of 3 means full breakout beyond all three bands in that direction.
4. Composite Trend Strength Score (0-100)
The strength score combines two inputs: the band penetration score converted to a 0-50 scale (each band = 16.7 points) and the RSI deviation from 50 on a 0-50 scale. The combination rewards moves that have both structural extension (price has pushed through multiple bands) and momentum confirmation (RSI is moving away from neutral):
Pine Script®
5. Distance-Based Band Coloring
Each band receives a gradient color whose intensity scales with how far price is from that band relative to its historical range. Bands that price has recently broken through or is pressing against are rendered more vividly. Bands far from price are nearly transparent. This creates a visual heat-map effect showing where structural tension exists:
Pine Script®
Features
Input Parameters
Ribbon Engine:
Filters:
Visuals / Dashboard:
How to Use This Indicator
Step 1: Read Trend Direction from the Ribbon
When the ribbon is green and sloping upward, the baseline trend is bullish. When red and sloping downward, bearish. A flat ribbon in neutral color indicates a non-trending market.
Step 2: Use Structure Score for Entry Timing
A bull signal fires when price is above the first upper band (score 1+) and the trend slope is upward with RSI and volume confirmation. A score of 2 or 3 indicates deeper structural extension — potentially overextended for entry, better for trailing a position.
Step 3: Watch for Pullbacks to the Ribbon
After a bull signal, price often pulls back toward the ribbon (slow SMEMA) before continuing. Entries from the ribbon during an active bull structure are higher-probability than chasing at the outer bands.
Step 4: Scale Position with Strength Score
A strength score above 70 (labeled Strong) indicates both structural extension and momentum alignment — use for higher conviction. Below 40 (Weak) may indicate a fading move or early-stage structure not worth full position sizing.

Indicator Limitations
Originality Statement
VSR is original in its use of the SMEMA-smoothed candle range as the band spacing unit. This indicator is published because:
Disclaimer
This indicator is provided for educational and informational purposes only. It is not financial advice or a recommendation to buy or sell any financial instrument. Trading involves substantial risk of loss. Band structure scores are based on historical price position relative to smoothed averages and do not predict future price movement. A score of 3 (maximum bullish extension) can increase further or reverse immediately. Always use proper risk management. The author is not responsible for any trading losses resulting from the use of this indicator.
-Made with passion by jackofalltrades
Introduction
Velox Structure Ribbon (VSR) is an open-source multi-band trend structure ribbon that uses a volatility-normalized, dynamically-spaced band system to visualize how far price has extended from its trend baseline and in which direction. The ribbon is anchored by a dual SMEMA core — a fast and slow double-smoothed moving average — and radiates six equidistant bands above and below the baseline, with spacing determined by the smoothed average candle range. Each band that price has penetrated adds one point to a 0-3 bull or bear structure score. A 0-100 composite trend strength score combines band penetration with RSI momentum. Volume confirmation and RSI filters are available to sharpen signal quality.
The problem VSR solves is that standard envelopes and Bollinger Bands use fixed or volatility-scaled offsets that can cluster bands too tightly in low-volatility environments and spread them too far in high-volatility ones. VSR normalizes band spacing using the market's own smoothed candle range, meaning band width automatically contracts in quiet markets and expands in active ones. This keeps the structure score meaningful across all conditions: three bands penetrated in a quiet market represents the same degree of extension relative to current volatility as three bands penetrated in a volatile market.
Core Concepts
1. SMEMA Ribbon Core
The ribbon center uses two SMEMA lines — slow (full period, default 20) and fast (half period). The slow SMEMA defines trend direction: sloping upward means the trend is bullish, downward means bearish. The fill between fast and slow creates a visual ribbon that contracts during consolidation and expands during trends:
2. Volatility-Normalized Band Spacing
The step unit for band placement is SMEMA applied to the high-low range over a long smoothing period (default 100 bars). This produces an adaptive measure of the average candle body size. Each of the six bands is placed at integer multiples of this step above and below the slow SMEMA:
Because the step automatically adjusts to market volatility, the bands always represent meaningful structural extensions rather than arbitrary percentage offsets.
3. Bull and Bear Structure Scoring
Each bar, the indicator counts how many upper bands price has broken through (bullish penetration) and how many lower bands (bearish penetration). Each penetrated band adds one point to the respective score:
A score of 0 means price is between the baseline and first band — neutral zone. Score of 1 means first structural extension. Score of 3 means full breakout beyond all three bands in that direction.
4. Composite Trend Strength Score (0-100)
The strength score combines two inputs: the band penetration score converted to a 0-50 scale (each band = 16.7 points) and the RSI deviation from 50 on a 0-50 scale. The combination rewards moves that have both structural extension (price has pushed through multiple bands) and momentum confirmation (RSI is moving away from neutral):
5. Distance-Based Band Coloring
Each band receives a gradient color whose intensity scales with how far price is from that band relative to its historical range. Bands that price has recently broken through or is pressing against are rendered more vividly. Bands far from price are nearly transparent. This creates a visual heat-map effect showing where structural tension exists:
Features
- Six-Band Structure Grid: Three bands above and three below the slow SMEMA baseline, dynamically spaced by the smoothed candle range
- Dual SMEMA Core Ribbon: Fast and slow baseline with gradient fill, colored by trend direction
- Trend Direction Diamond: A small diamond marker on the baseline at every trend flip (when the slow SMEMA changes slope direction)
- Bull / Bear Structure Score (0-3): Real-time count of penetrated upper or lower bands displayed in signal labels and the dashboard
- Composite Strength Score (0-100): Combined band penetration and RSI momentum score with Strong/Moderate/Weak label
- RSI Momentum Filter: Optional filter requiring RSI alignment before a signal is confirmed (configurable threshold, default 52)
- Volume Filter: Optional filter requiring above-average volume (configurable multiplier, default 1.1x the 20-bar SMA). Auto-disables on volume-free instruments
- Signal Labels: Small numeric labels at bull and bear signal bars showing the structure score (1, 2, or 3)
- Strength Bar (Bottom Right): A visual bar table showing filled cells proportional to the current bull or bear structure score
- Candle Coloring: Bar colors reflect trend direction at reduced opacity
- 9-Row Dashboard (Top Right): Trend direction, last signal and bars-since count, strength score with label, bull and bear band counts, RSI value, timeframe, and version
- Watermark: JackOfAllTrades signature at chart center-bottom
- Alerts: Bull signal, bear signal, and trend-flip alertconditions with optional JSON webhook format
Input Parameters
Ribbon Engine:
- SMEMA Length: Core period for the slow baseline (default: 20). Fast = L/2
- Step Smoothing: SMA period for the candle-range volatility step (default: 100)
Filters:
- RSI Length: Momentum confirmation period (default: 14)
- RSI Threshold: Minimum RSI for bull signal confirmation (default: 52). Bear mirror = 100 - threshold
- Volume Filter: Enable/disable volume confirmation (default: off)
- Volume Multiplier: Required volume multiple of the 20-bar SMA (default: 1.1)
Visuals / Dashboard:
- Theme: Auto, Dark, or Light
- Show Distance Bands: Toggle the six structural bands
- Show Core Ribbon: Toggle the fast/slow SMEMA ribbon and fill
- Show Signals: Toggle the numeric signal labels
- Show Strength Bar: Toggle the bottom-right score visualization
- Show Dashboard: Toggle the 9-row information panel
- Color Palette: Bull, Bear, and Neutral colors are individually customizable
How to Use This Indicator
Step 1: Read Trend Direction from the Ribbon
When the ribbon is green and sloping upward, the baseline trend is bullish. When red and sloping downward, bearish. A flat ribbon in neutral color indicates a non-trending market.
Step 2: Use Structure Score for Entry Timing
A bull signal fires when price is above the first upper band (score 1+) and the trend slope is upward with RSI and volume confirmation. A score of 2 or 3 indicates deeper structural extension — potentially overextended for entry, better for trailing a position.
Step 3: Watch for Pullbacks to the Ribbon
After a bull signal, price often pulls back toward the ribbon (slow SMEMA) before continuing. Entries from the ribbon during an active bull structure are higher-probability than chasing at the outer bands.
Step 4: Scale Position with Strength Score
A strength score above 70 (labeled Strong) indicates both structural extension and momentum alignment — use for higher conviction. Below 40 (Weak) may indicate a fading move or early-stage structure not worth full position sizing.
Indicator Limitations
- The warmup period (SMEMA length x3 or step smoothing + 50, whichever is larger) means the indicator is inactive for the first several dozen bars on any chart
- The band spacing adapts to the smoothed candle range with a 100-bar lookback. On instruments with sharp volatility regime changes, the bands may lag behind the new volatility environment for many bars
- The volume filter is automatically disabled when volume data is unavailable (e.g., indices, some forex pairs). In those cases, volume confirmation is effectively always true regardless of the toggle setting
- Signal labels fire on every bull or bear structure bar — this can be frequent in strongly trending markets. The labels are informational, not entry triggers, and users should apply their own discretion for entry timing
Originality Statement
VSR is original in its use of the SMEMA-smoothed candle range as the band spacing unit. This indicator is published because:
- The volatility-normalized step unit (SMEMA of high-low range) is a unique approach to band spacing that differs from standard ATR envelopes, Bollinger Bands (which use standard deviation), and Keltner Channels (which use raw ATR). The SMEMA smoothing produces a more stable, noise-resistant step unit than raw ATR
- The 0-3 integer band-penetration scoring is a discrete structural measure that complements continuous oscillators. It quantifies how far price has extended structurally rather than how fast it has moved
- The distance-based gradient coloring using percentile normalization creates an adaptive visual heat-map — the same visual logic is computationally novel within the band-coloring approach
- The composite strength score combining band penetration with RSI deviation creates a measure that rewards both structural extension and momentum alignment simultaneously
Disclaimer
This indicator is provided for educational and informational purposes only. It is not financial advice or a recommendation to buy or sell any financial instrument. Trading involves substantial risk of loss. Band structure scores are based on historical price position relative to smoothed averages and do not predict future price movement. A score of 3 (maximum bullish extension) can increase further or reverse immediately. Always use proper risk management. The author is not responsible for any trading losses resulting from the use of this indicator.
-Made with passion by jackofalltrades
Script de código abierto
Fiel al espíritu de TradingView, el creador de este script lo ha convertido en código abierto, para que los traders puedan revisar y verificar su funcionalidad. ¡Enhorabuena al autor! Aunque puede utilizarlo de forma gratuita, recuerde que cualquier republicación del código está sujeta a nuestras Normas internas.

The Institutional Grade Trading Ecosystem, Built to win trades 📈
Get Access 👇
jackofalltrades.vip 🌐
t.me/jackofalltradesvip 🃏
Get Access 👇
jackofalltrades.vip 🌐
t.me/jackofalltradesvip 🃏
Exención de responsabilidad
La información y las publicaciones no constituyen, ni deben considerarse como, asesoramiento o recomendaciones financieras, de inversión, de trading u otro tipo, proporcionadas o respaldadas por TradingView. Obtenga más información en Condiciones de uso.
Script de código abierto
Fiel al espíritu de TradingView, el creador de este script lo ha convertido en código abierto, para que los traders puedan revisar y verificar su funcionalidad. ¡Enhorabuena al autor! Aunque puede utilizarlo de forma gratuita, recuerde que cualquier republicación del código está sujeta a nuestras Normas internas.
The Institutional Grade Trading Ecosystem, Built to win trades 📈
Get Access 👇
jackofalltrades.vip 🌐
t.me/jackofalltradesvip 🃏
Get Access 👇
jackofalltrades.vip 🌐
t.me/jackofalltradesvip 🃏
Exención de responsabilidad
La información y las publicaciones no constituyen, ni deben considerarse como, asesoramiento o recomendaciones financieras, de inversión, de trading u otro tipo, proporcionadas o respaldadas por TradingView. Obtenga más información en Condiciones de uso.