SAMS Early Morning Range Lines
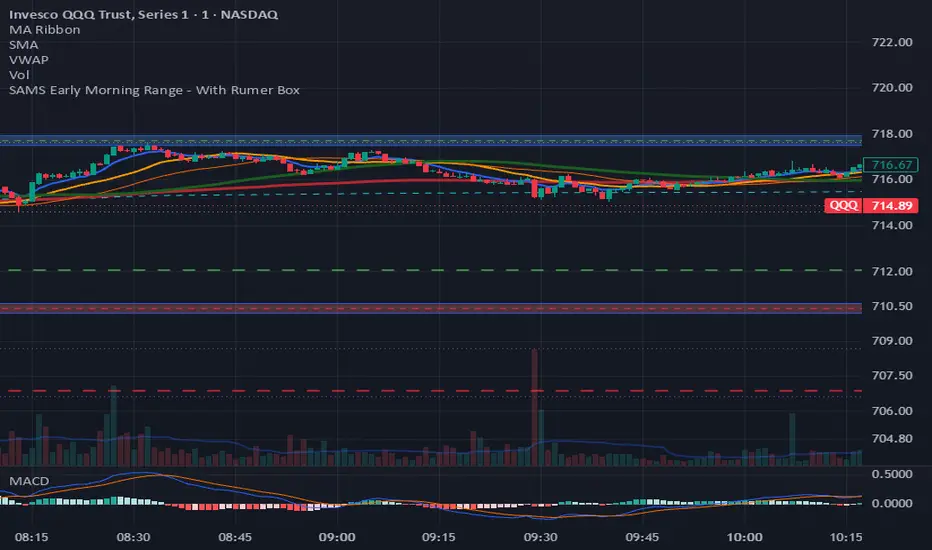
This indicator maps the premarket / early-morning range (EMR) and uses that range as a reference for regular-session structure and breakout signals.
What it plots
EMR high / low (green / red): the high and low printed during the 04:00–09:30 America/New_York window. These levels persist into the regular session.
Previous-day RTH range (Rumer Box): prior regular-session high and low, with a light purple fill between them. The prior RTH range is only updated after a full RTH session has printed.
Premarket bands (RTH only): optional ±% envelopes around the EMR high and EMR low. Default is 0.03%. Use these as a buffer around the premarket extremes instead of treating the raw high/low as a single line.
Sessions are defined in Eastern time (America/New_York) so DST is handled by TradingView’s session engine.
Signals
Signals fire only after the EMR session ends and only if EMR high and low exist.
Buy: first valid break of EMR high
Sell: first valid break of EMR low
Re-Buy: after a sell, price recrosses back up through EMR low
Re-Sell: after a buy, price recrosses back down through EMR high
Only one primary buy and one primary sell are allowed per day unless a re-entry flips the state.
Signal modes
Crossover Candle — close crosses the EMR level.
First Fully Crossed — the bar’s low crosses above EMR high (buy) or the bar’s high crosses below EMR low (sell). Stricter than a close-only cross.
Open Confirmation — the cross is detected on the current bar, then confirmed on the next bar if open continues in the breakout direction relative to the prior close. Reduces same-bar fakeouts.
Default mode is Open Confirmation.
Alerts
On a confirmed signal the script fires a once-per-bar-close alert:
SAMS_EMR_BUY / SELL / RE_BUY / RE_SELL
plus ticker, interval, and close.
Create alerts from the indicator with “Any alert() function call”.
Suggested use
Use EMR high/low as the first overnight auction box. The previous-day RTH box is context for whether the open is inside, above, or below yesterday’s cash range. Bands are for traders who want a small buffer instead of a hard level. This is a level + confirmation tool, not a standalone strategy. Combine with your own risk rules, size, and higher-timeframe bias.
Notes
Works best on intraday charts that include premarket data (1–15 minute is typical). If the symbol or session settings omit 04:00–09:30 ET prints, EMR high/low will be incomplete. Past session levels and signals are not a guarantee of future results.
What it plots
EMR high / low (green / red): the high and low printed during the 04:00–09:30 America/New_York window. These levels persist into the regular session.
Previous-day RTH range (Rumer Box): prior regular-session high and low, with a light purple fill between them. The prior RTH range is only updated after a full RTH session has printed.
Premarket bands (RTH only): optional ±% envelopes around the EMR high and EMR low. Default is 0.03%. Use these as a buffer around the premarket extremes instead of treating the raw high/low as a single line.
Sessions are defined in Eastern time (America/New_York) so DST is handled by TradingView’s session engine.
Signals
Signals fire only after the EMR session ends and only if EMR high and low exist.
Buy: first valid break of EMR high
Sell: first valid break of EMR low
Re-Buy: after a sell, price recrosses back up through EMR low
Re-Sell: after a buy, price recrosses back down through EMR high
Only one primary buy and one primary sell are allowed per day unless a re-entry flips the state.
Signal modes
Crossover Candle — close crosses the EMR level.
First Fully Crossed — the bar’s low crosses above EMR high (buy) or the bar’s high crosses below EMR low (sell). Stricter than a close-only cross.
Open Confirmation — the cross is detected on the current bar, then confirmed on the next bar if open continues in the breakout direction relative to the prior close. Reduces same-bar fakeouts.
Default mode is Open Confirmation.
Alerts
On a confirmed signal the script fires a once-per-bar-close alert:
SAMS_EMR_BUY / SELL / RE_BUY / RE_SELL
plus ticker, interval, and close.
Create alerts from the indicator with “Any alert() function call”.
Suggested use
Use EMR high/low as the first overnight auction box. The previous-day RTH box is context for whether the open is inside, above, or below yesterday’s cash range. Bands are for traders who want a small buffer instead of a hard level. This is a level + confirmation tool, not a standalone strategy. Combine with your own risk rules, size, and higher-timeframe bias.
Notes
Works best on intraday charts that include premarket data (1–15 minute is typical). If the symbol or session settings omit 04:00–09:30 ET prints, EMR high/low will be incomplete. Past session levels and signals are not a guarantee of future results.

Exención de responsabilidad
La información y las publicaciones no constituyen, ni deben considerarse como, asesoramiento o recomendaciones financieras, de inversión, de trading u otro tipo, proporcionadas o respaldadas por TradingView. Obtenga más información en Condiciones de uso.
Exención de responsabilidad
La información y las publicaciones no constituyen, ni deben considerarse como, asesoramiento o recomendaciones financieras, de inversión, de trading u otro tipo, proporcionadas o respaldadas por TradingView. Obtenga más información en Condiciones de uso.