OPEN-SOURCE SCRIPT
Previous ATR SandFx
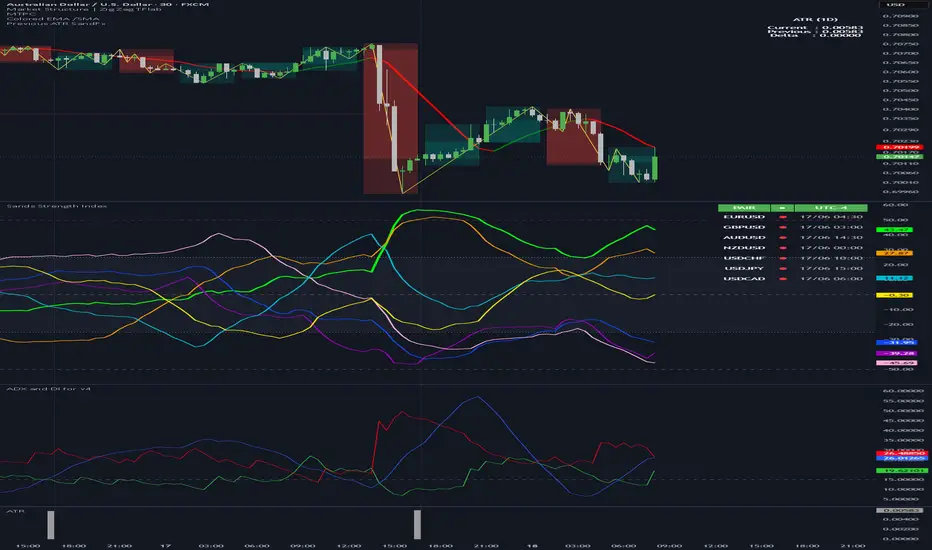
📊 Previous ATR Clean Indicator
Previous ATR Clean is a simple indicator designed to monitor market volatility changes by comparing the current candle ATR (Current ATR) with the previous candle ATR (Previous ATR). ATR (Average True Range) measures the size of price movement, not the direction of the trend. This indicator helps traders identify whether the market is experiencing volatility expansion (increasing movement) or volatility contraction (decreasing movement).
Current ATR shows the current market volatility condition. Previous ATR shows the volatility from the previous candle as a comparison. Delta ATR represents the difference between them:
Delta = Current ATR - Previous ATR
If Delta is positive (+), it means ATR is increasing → candle range is expanding → the market is gaining energy and momentum. This condition often appears during breakouts or when a trend starts developing.
If Delta is negative (-), it means ATR is decreasing → candle range is shrinking → the market is losing energy or entering a consolidation phase.
This indicator can be used to:
✅ Identify whether the market is active or slow
✅ Measure breakout strength
✅ Avoid entries during low volatility conditions
✅ Adjust stop loss and target distance based on market conditions
Example:
Current ATR: 3.50
Previous ATR: 2.80
Delta: +0.70
Meaning: volatility is increasing and the market is expanding.
Current ATR: 2.50
Previous ATR: 3.20
Delta: -0.70
Meaning: volatility is decreasing and the market is slowing down.
ATR does not provide buy or sell signals. It helps traders understand market energy and volatility conditions. Combine it with other analysis tools such as market structure, support & resistance, volume, or trend direction for better trading decisions.
Trade with volatility, not against it. 📈
Previous ATR Clean is a simple indicator designed to monitor market volatility changes by comparing the current candle ATR (Current ATR) with the previous candle ATR (Previous ATR). ATR (Average True Range) measures the size of price movement, not the direction of the trend. This indicator helps traders identify whether the market is experiencing volatility expansion (increasing movement) or volatility contraction (decreasing movement).
Current ATR shows the current market volatility condition. Previous ATR shows the volatility from the previous candle as a comparison. Delta ATR represents the difference between them:
Delta = Current ATR - Previous ATR
If Delta is positive (+), it means ATR is increasing → candle range is expanding → the market is gaining energy and momentum. This condition often appears during breakouts or when a trend starts developing.
If Delta is negative (-), it means ATR is decreasing → candle range is shrinking → the market is losing energy or entering a consolidation phase.
This indicator can be used to:
✅ Identify whether the market is active or slow
✅ Measure breakout strength
✅ Avoid entries during low volatility conditions
✅ Adjust stop loss and target distance based on market conditions
Example:
Current ATR: 3.50
Previous ATR: 2.80
Delta: +0.70
Meaning: volatility is increasing and the market is expanding.
Current ATR: 2.50
Previous ATR: 3.20
Delta: -0.70
Meaning: volatility is decreasing and the market is slowing down.
ATR does not provide buy or sell signals. It helps traders understand market energy and volatility conditions. Combine it with other analysis tools such as market structure, support & resistance, volume, or trend direction for better trading decisions.
Trade with volatility, not against it. 📈
Script de código abierto
Fiel al espíritu de TradingView, el creador de este script lo ha convertido en código abierto, para que los traders puedan revisar y verificar su funcionalidad. ¡Enhorabuena al autor! Aunque puede utilizarlo de forma gratuita, recuerde que cualquier republicación del código está sujeta a nuestras Normas internas.

Exención de responsabilidad
La información y las publicaciones no constituyen, ni deben considerarse como, asesoramiento o recomendaciones financieras, de inversión, de trading u otro tipo, proporcionadas o respaldadas por TradingView. Obtenga más información en Condiciones de uso.
Script de código abierto
Fiel al espíritu de TradingView, el creador de este script lo ha convertido en código abierto, para que los traders puedan revisar y verificar su funcionalidad. ¡Enhorabuena al autor! Aunque puede utilizarlo de forma gratuita, recuerde que cualquier republicación del código está sujeta a nuestras Normas internas.
Exención de responsabilidad
La información y las publicaciones no constituyen, ni deben considerarse como, asesoramiento o recomendaciones financieras, de inversión, de trading u otro tipo, proporcionadas o respaldadas por TradingView. Obtenga más información en Condiciones de uso.