EMA Smoothed Kijun-Sen [NJ]
✧ OVERVIEW ✧
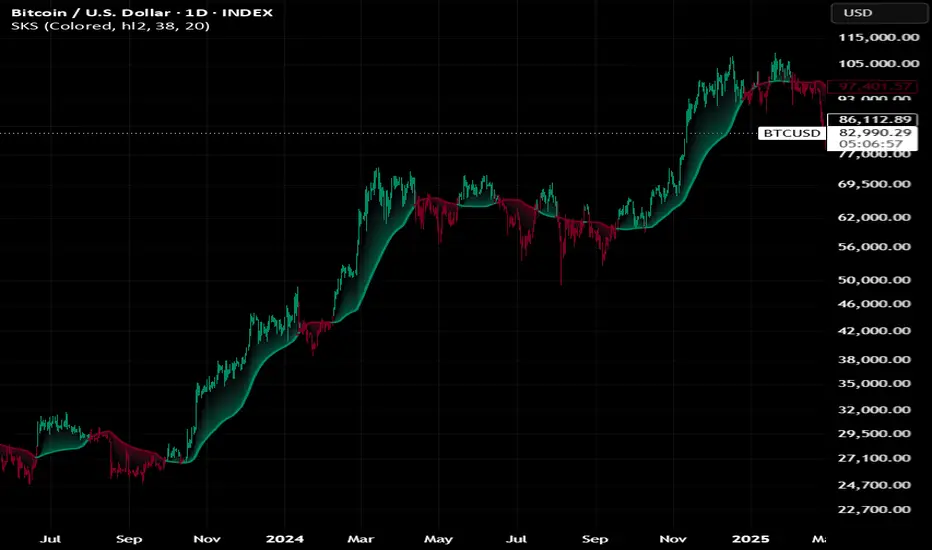
EMA Smoothed Kijun-Sen is a trend-following indicator that applies exponential smoothing to the Kijun-sen, the baseline of the Ichimoku Cloud.
Kijun-sen is the midpoint between the highest and lowest values over a selected period. Smoothing it with an EMA turns the stepped baseline into a continuous line that is less sensitive to single swing highs and lows.
Price position relative to the smoothed line determines the current bullish or bearish condition, which is displayed using colored candles, a colored baseline and a gradient glow.

✧ SETTINGS ✧
Color Mode
Switches between colored and neutral visualization.
Color Candles
Shows or hides candle coloring based on the current signal.
KS Source
Selects the price source used for the Kijun-sen calculation.
KS Length
Controls how many bars are used to find the highest and lowest values for the Kijun-sen.
Smoothing Length
Controls how many bars are used for the EMA applied to the Kijun-sen.
✧ HOW IT WORKS ✧
Kijun-Sen
Indicator finds the highest and lowest values of selected source over KS Length.
Kijun-Sen = (Highest Value + Lowest Value) / 2
The result represents the equilibrium point of the recent price range.
Smoothing
Kijun-sen only changes when a new high or low enters or leaves the lookback period, which creates flat steps.
An exponential moving average over Smoothing Length converts these steps into a continuous baseline.
Signal Logic
A bullish condition is active when the entire candle is above the smoothed Kijun-sen.
A bearish condition is activated as soon as the low of a candle moves below the smoothed Kijun-sen, including candles that cross through the line.
✧ VISUALIZATION ✧
Smoothed Kijun-sen changes color based on the active condition:
Green represents a bullish condition.
Red represents a bearish condition.
Neutral mode displays the same conditions using light and dark shades.
A gradient glow fills the area between the smoothed Kijun-sen and a 10-period simple moving average of closing price. It is strongest at the baseline and fades toward price.
Same signal colors can optionally be applied directly to the chart candles.
✧ USAGE ✧
EMA Smoothed Kijun-Sen can be used to identify:
Bullish and bearish trend conditions
Dynamic trend support and resistance
Price position relative to range equilibrium
Directional market bias
Trend confirmation
Additional confirmation for other technical analysis
Combining range-based equilibrium with exponential smoothing is designed to provide a stable trend baseline that still reflects changes in the recent price range.
As with any technical indicator, it is best used alongside other forms of analysis rather than as a standalone entry or exit signal.
EMA Smoothed Kijun-Sen is a trend-following indicator that applies exponential smoothing to the Kijun-sen, the baseline of the Ichimoku Cloud.
Kijun-sen is the midpoint between the highest and lowest values over a selected period. Smoothing it with an EMA turns the stepped baseline into a continuous line that is less sensitive to single swing highs and lows.
Price position relative to the smoothed line determines the current bullish or bearish condition, which is displayed using colored candles, a colored baseline and a gradient glow.
✧ SETTINGS ✧
Color Mode
Switches between colored and neutral visualization.
Color Candles
Shows or hides candle coloring based on the current signal.
KS Source
Selects the price source used for the Kijun-sen calculation.
KS Length
Controls how many bars are used to find the highest and lowest values for the Kijun-sen.
Smoothing Length
Controls how many bars are used for the EMA applied to the Kijun-sen.
✧ HOW IT WORKS ✧
Kijun-Sen
Indicator finds the highest and lowest values of selected source over KS Length.
Kijun-Sen = (Highest Value + Lowest Value) / 2
The result represents the equilibrium point of the recent price range.
Smoothing
Kijun-sen only changes when a new high or low enters or leaves the lookback period, which creates flat steps.
An exponential moving average over Smoothing Length converts these steps into a continuous baseline.
Signal Logic
A bullish condition is active when the entire candle is above the smoothed Kijun-sen.
A bearish condition is activated as soon as the low of a candle moves below the smoothed Kijun-sen, including candles that cross through the line.
✧ VISUALIZATION ✧
Smoothed Kijun-sen changes color based on the active condition:
Green represents a bullish condition.
Red represents a bearish condition.
Neutral mode displays the same conditions using light and dark shades.
A gradient glow fills the area between the smoothed Kijun-sen and a 10-period simple moving average of closing price. It is strongest at the baseline and fades toward price.
Same signal colors can optionally be applied directly to the chart candles.
✧ USAGE ✧
EMA Smoothed Kijun-Sen can be used to identify:
Bullish and bearish trend conditions
Dynamic trend support and resistance
Price position relative to range equilibrium
Directional market bias
Trend confirmation
Additional confirmation for other technical analysis
Combining range-based equilibrium with exponential smoothing is designed to provide a stable trend baseline that still reflects changes in the recent price range.
As with any technical indicator, it is best used alongside other forms of analysis rather than as a standalone entry or exit signal.

Exención de responsabilidad
La información y las publicaciones no constituyen, ni deben considerarse como, asesoramiento o recomendaciones financieras, de inversión, de trading u otro tipo, proporcionadas o respaldadas por TradingView. Obtenga más información en Condiciones de uso.
Exención de responsabilidad
La información y las publicaciones no constituyen, ni deben considerarse como, asesoramiento o recomendaciones financieras, de inversión, de trading u otro tipo, proporcionadas o respaldadas por TradingView. Obtenga más información en Condiciones de uso.