OPEN-SOURCE SCRIPT
Regime & Structure Engine [JOAT]
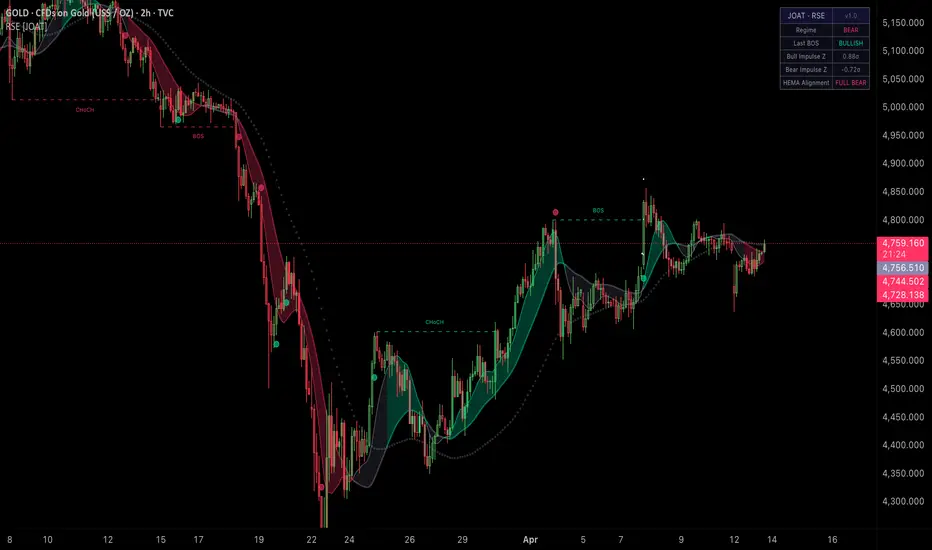
Regime & Structure Engine [JOAT]
Introduction
Markets do not move randomly — they cycle through defined behavioral states: trending phases where momentum compounds in one direction, and ranging phases where price consolidates before the next impulse. Identifying which state the market is currently in, and detecting when structural breaks signal a transition, is fundamental to any disciplined trading approach. The Regime & Structure Engine [JOAT] is built around that single core principle: before anything else, know your regime.
This indicator unifies three distinct analytical layers into a single overlay system. The first layer is the Hull-EMA Hybrid (HEMA), a custom moving average that resolves the trade-off between smoothness and responsiveness by combining double-weighted EMA calculation with a square-root length final smoothing. The second layer is a three-state confirmed regime engine that uses the relative alignment of three HEMA periods to classify market condition as bull, bear, or neutral — with a mandatory two-bar confirmation to eliminate false transitions. The third layer is a market structure engine based on classical swing pivot logic, capable of identifying Break of Structure (BOS) and Change of Character (CHoCH) events that signal genuine momentum shifts.
All of this is augmented by a Z-score cumulative impulse detector that quantifies the statistical significance of directional momentum streaks, a trend cloud that visually represents regime state through gradient fills, proximity-based bar coloring that encodes distance from the HEMA mid-layer, a configurable alert system, and a compact six-row dashboard. Every signal in this indicator is anchored to confirmed bars only, eliminating any look-ahead repainting.

Core Concepts
1. Hull-EMA Hybrid (HEMA) Moving Average
The foundational calculation of this indicator is the HEMA — a three-step smoothing function that delivers both noise reduction and lag compensation. A standard EMA applies uniform smoothing that creates meaningful lag on higher periods. Hull Moving Averages address lag through weighted differencing but can produce jagged outputs. The HEMA bridges this by constructing the Hull-style weighted difference first, then applying a square-root-period EMA as the final smoother.
Pine Script®
Three instances are calculated at lengths 20, 50, and 100, producing a fast, slow, and macro trend layer respectively. The fast layer reacts to short-term price action, the slow layer represents the primary trend, and the macro layer anchors the broader structural bias. When all three are aligned in sequence (fast above slow above macro, or inverse), the trend is considered directionally clean.
2. Three-State Confirmed Regime Engine
Regime classification is determined by the ordinal alignment of all three HEMA layers. A raw bull signal requires hema1 greater than hema2, which must in turn be greater than hema3. The inverse defines raw bear. Any other arrangement is classified as neutral. To prevent rapid regime flipping on borderline conditions, a two-bar confirmation requirement is enforced: the raw signal must hold for at least two consecutive bars before the confirmed regime variable updates.
Pine Script®
This confirmation mechanism is critical in volatile markets where HEMA layers can briefly reorder on a single candle only to revert immediately. The two-bar requirement sacrifices minimal reaction speed in exchange for a meaningful reduction in false regime transitions.
3. Z-Score Cumulative Impulse Detection
Regime direction tells you the structural bias. The Z-score impulse system tells you when that bias is being expressed with statistical force. Rather than measuring a single bar's momentum, this system accumulates consecutive directional closes into a running streak — a cumulative bull or bear pressure counter — then normalizes that streak against its own historical mean and standard deviation.
Pine Script®
An impulse fires when the Z-score exceeds the user-defined threshold (default: 2.0 sigma). This ensures that only statistically unusual momentum streaks generate signals, filtering out the ordinary ebb and flow of price during low-conviction moves.
4. BOS and CHoCH Market Structure
Market structure tracking is built on classical pivot high/low detection using Pine Script's built-in ta.pivothigh and ta.pivotlow functions. A Break of Structure (BOS) occurs when price closes or wicks beyond the most recent swing high (bullish BOS) or swing low (bearish BOS). A Change of Character (CHoCH) is a BOS that opposes the direction of the prior BOS — indicating a potential regime reversal rather than continuation.
Pine Script®
CHoCH events are particularly significant because they represent the market's first structural evidence of a trend change — not merely a continuation of prior momentum. Distinguishing BOS from CHoCH allows traders to calibrate their response: a BOS in trend direction is a continuation entry opportunity, while a CHoCH warrants reassessment of existing positions.
5. Trend Cloud and Proximity Bar Coloring
The trend cloud fills the space between the HEMA fast and slow layers. The fill color matches the confirmed regime — teal for bull, red for bear, gray for neutral — creating an immediate visual encoding of market state across the chart. Bar coloring is driven by a normalized proximity calculation using the 14-period ATR as a reference distance.
Pine Script®
Bars that are far from the HEMA slow layer receive more saturated coloring, while bars trading near the HEMA mid-line are rendered at reduced opacity. This creates an intuitive gradient where extreme dislocations are visually prominent.
Features
Input Parameters
HEMA Settings:
Regime Settings:
Structure Settings:
Z-Score Settings:
Display Settings:
How to Use This Indicator
Step 1: Establish Regime Context
Before analyzing any signal, check the dashboard and the trend cloud to identify the confirmed regime. A bull regime (all three HEMA layers in ascending order with a teal cloud) means the structural bias favors long positions. A bear regime (descending alignment with a red cloud) favors shorts. A neutral regime suggests consolidation — reduce position sizing or stand aside. The regime confirmation requirement means the dashboard will update one to two bars after alignment begins, giving you a cleaner entry rather than reacting to the first crossover.
Step 2: Wait for Structure to Break
Within the context of the confirmed regime, watch for BOS events in the trend direction. A bullish BOS during a bull regime is a continuation structure signal — it means price has broken above a prior swing high, suggesting the up-trend is extending. A bearish BOS during a bull regime, especially if classified as a CHoCH, is your first warning that the structure may be shifting. Use the BOS labels on the chart to track the sequence of structural breaks over time.
Step 3: Confirm with Z-Score Impulse
A BOS or CHoCH becomes significantly more actionable when accompanied by a Z-score impulse signal in the same direction. When the cumulative bull streak normalized to 2+ sigma fires at the same time as or immediately following a bullish BOS, the move is backed by sustained directional momentum — not a single large candle. When regime, structure, and impulse all align, the signal quality is at its highest.
Step 4: Manage Position with HEMA Proximity
Once in a position, the proximity bar coloring helps manage exits. Bars that are far from HEMA mid (highly saturated) represent extended conditions — areas where mean reversion risk is elevated. Bars near HEMA mid are in equilibrium. Exits on strength (closing during a high-saturation bullish bar after a BOS continuation trade) allow for locking in gains at points of extension rather than waiting for a reversal to develop.

Indicator Limitations
Originality Statement
The Regime & Structure Engine is not a repackaging of any single existing indicator. It is a purpose-built synthesis of methodologies that individually exist in various forms but have not been combined in this specific architecture.
Disclaimer
The Regime & Structure Engine [JOAT] is provided for educational and informational purposes only. It is a technical analysis tool and does not constitute financial advice. Past behavior of price relative to indicator signals does not guarantee future results. All trading involves risk, including the potential loss of principal. Users are solely responsible for their own trading decisions. Always conduct your own due diligence and consider consulting a licensed financial professional before making any investment decisions.
-Made with passion by officialjackofalltrades
Introduction
Markets do not move randomly — they cycle through defined behavioral states: trending phases where momentum compounds in one direction, and ranging phases where price consolidates before the next impulse. Identifying which state the market is currently in, and detecting when structural breaks signal a transition, is fundamental to any disciplined trading approach. The Regime & Structure Engine [JOAT] is built around that single core principle: before anything else, know your regime.
This indicator unifies three distinct analytical layers into a single overlay system. The first layer is the Hull-EMA Hybrid (HEMA), a custom moving average that resolves the trade-off between smoothness and responsiveness by combining double-weighted EMA calculation with a square-root length final smoothing. The second layer is a three-state confirmed regime engine that uses the relative alignment of three HEMA periods to classify market condition as bull, bear, or neutral — with a mandatory two-bar confirmation to eliminate false transitions. The third layer is a market structure engine based on classical swing pivot logic, capable of identifying Break of Structure (BOS) and Change of Character (CHoCH) events that signal genuine momentum shifts.
All of this is augmented by a Z-score cumulative impulse detector that quantifies the statistical significance of directional momentum streaks, a trend cloud that visually represents regime state through gradient fills, proximity-based bar coloring that encodes distance from the HEMA mid-layer, a configurable alert system, and a compact six-row dashboard. Every signal in this indicator is anchored to confirmed bars only, eliminating any look-ahead repainting.
Core Concepts
1. Hull-EMA Hybrid (HEMA) Moving Average
The foundational calculation of this indicator is the HEMA — a three-step smoothing function that delivers both noise reduction and lag compensation. A standard EMA applies uniform smoothing that creates meaningful lag on higher periods. Hull Moving Averages address lag through weighted differencing but can produce jagged outputs. The HEMA bridges this by constructing the Hull-style weighted difference first, then applying a square-root-period EMA as the final smoother.
Three instances are calculated at lengths 20, 50, and 100, producing a fast, slow, and macro trend layer respectively. The fast layer reacts to short-term price action, the slow layer represents the primary trend, and the macro layer anchors the broader structural bias. When all three are aligned in sequence (fast above slow above macro, or inverse), the trend is considered directionally clean.
2. Three-State Confirmed Regime Engine
Regime classification is determined by the ordinal alignment of all three HEMA layers. A raw bull signal requires hema1 greater than hema2, which must in turn be greater than hema3. The inverse defines raw bear. Any other arrangement is classified as neutral. To prevent rapid regime flipping on borderline conditions, a two-bar confirmation requirement is enforced: the raw signal must hold for at least two consecutive bars before the confirmed regime variable updates.
This confirmation mechanism is critical in volatile markets where HEMA layers can briefly reorder on a single candle only to revert immediately. The two-bar requirement sacrifices minimal reaction speed in exchange for a meaningful reduction in false regime transitions.
3. Z-Score Cumulative Impulse Detection
Regime direction tells you the structural bias. The Z-score impulse system tells you when that bias is being expressed with statistical force. Rather than measuring a single bar's momentum, this system accumulates consecutive directional closes into a running streak — a cumulative bull or bear pressure counter — then normalizes that streak against its own historical mean and standard deviation.
An impulse fires when the Z-score exceeds the user-defined threshold (default: 2.0 sigma). This ensures that only statistically unusual momentum streaks generate signals, filtering out the ordinary ebb and flow of price during low-conviction moves.
4. BOS and CHoCH Market Structure
Market structure tracking is built on classical pivot high/low detection using Pine Script's built-in ta.pivothigh and ta.pivotlow functions. A Break of Structure (BOS) occurs when price closes or wicks beyond the most recent swing high (bullish BOS) or swing low (bearish BOS). A Change of Character (CHoCH) is a BOS that opposes the direction of the prior BOS — indicating a potential regime reversal rather than continuation.
CHoCH events are particularly significant because they represent the market's first structural evidence of a trend change — not merely a continuation of prior momentum. Distinguishing BOS from CHoCH allows traders to calibrate their response: a BOS in trend direction is a continuation entry opportunity, while a CHoCH warrants reassessment of existing positions.
5. Trend Cloud and Proximity Bar Coloring
The trend cloud fills the space between the HEMA fast and slow layers. The fill color matches the confirmed regime — teal for bull, red for bear, gray for neutral — creating an immediate visual encoding of market state across the chart. Bar coloring is driven by a normalized proximity calculation using the 14-period ATR as a reference distance.
Bars that are far from the HEMA slow layer receive more saturated coloring, while bars trading near the HEMA mid-line are rendered at reduced opacity. This creates an intuitive gradient where extreme dislocations are visually prominent.
Features
- HEMA Triple Layer: Three independent Hull-EMA Hybrid instances at periods 20, 50, and 100 provide fast, primary, and macro trend context simultaneously.
- Confirmed Regime State: Two-bar confirmation gate prevents false regime transitions on temporary HEMA crossovers, reducing noise on volatile instruments.
- BOS Detection: Swing-based Break of Structure signals on both bullish and bearish side, drawn at confirmed bars only with no look-ahead.
- CHoCH Detection: Change of Character identification when BOS direction opposes the prior structural break, highlighting potential trend reversal zones.
- Z-Score Impulse: Statistically normalized cumulative momentum streaks that fire signals only when directional pressure reaches a configurable sigma threshold.
- Gradient Trend Cloud: Dynamic fill between HEMA layers color-coded by regime for instant visual orientation on any timeframe.
- Proximity Bar Coloring: ATR-normalized distance from HEMA mid controls bar color alpha, making dislocations visually distinct.
- Six-Row Dashboard: Compact table displaying regime, last BOS direction, bull Z-score, bear Z-score, and HEMA layer alignment.
- No Repainting: All signals gated behind barstate.isconfirmed — no signals are printed on unfinished bars.
- Full Alert Coverage: Seven alert conditions covering BOS, CHoCH, impulse, and regime flip events.
Input Parameters
HEMA Settings:
- Fast Length: Period for the HEMA fast layer (default: 20)
- Slow Length: Period for the HEMA slow layer (default: 50)
- Macro Length: Period for the HEMA macro layer (default: 100)
- Source: Price source for all HEMA calculations (default: close)
Regime Settings:
- Confirmation Bars: Number of consecutive bars required to confirm a regime change (default: 2)
Structure Settings:
- Swing Length: Pivot lookback for swing high/low detection (default: 10)
- Show BOS Labels: Toggle BOS annotation labels on the chart (default: true)
- Show CHoCH Labels: Toggle CHoCH annotation labels on the chart (default: true)
Z-Score Settings:
- Z Lookback: Rolling window for Z-score mean and standard deviation (default: 50)
- Z Threshold: Sigma level required to fire an impulse signal (default: 2.0)
Display Settings:
- Show Trend Cloud: Toggle the gradient fill between HEMA layers (default: true)
- Show Bar Colors: Toggle proximity-based bar coloring (default: true)
- Show Dashboard: Toggle the six-row information table (default: true)
How to Use This Indicator
Step 1: Establish Regime Context
Before analyzing any signal, check the dashboard and the trend cloud to identify the confirmed regime. A bull regime (all three HEMA layers in ascending order with a teal cloud) means the structural bias favors long positions. A bear regime (descending alignment with a red cloud) favors shorts. A neutral regime suggests consolidation — reduce position sizing or stand aside. The regime confirmation requirement means the dashboard will update one to two bars after alignment begins, giving you a cleaner entry rather than reacting to the first crossover.
Step 2: Wait for Structure to Break
Within the context of the confirmed regime, watch for BOS events in the trend direction. A bullish BOS during a bull regime is a continuation structure signal — it means price has broken above a prior swing high, suggesting the up-trend is extending. A bearish BOS during a bull regime, especially if classified as a CHoCH, is your first warning that the structure may be shifting. Use the BOS labels on the chart to track the sequence of structural breaks over time.
Step 3: Confirm with Z-Score Impulse
A BOS or CHoCH becomes significantly more actionable when accompanied by a Z-score impulse signal in the same direction. When the cumulative bull streak normalized to 2+ sigma fires at the same time as or immediately following a bullish BOS, the move is backed by sustained directional momentum — not a single large candle. When regime, structure, and impulse all align, the signal quality is at its highest.
Step 4: Manage Position with HEMA Proximity
Once in a position, the proximity bar coloring helps manage exits. Bars that are far from HEMA mid (highly saturated) represent extended conditions — areas where mean reversion risk is elevated. Bars near HEMA mid are in equilibrium. Exits on strength (closing during a high-saturation bullish bar after a BOS continuation trade) allow for locking in gains at points of extension rather than waiting for a reversal to develop.
Indicator Limitations
- The two-bar regime confirmation introduces a brief delay relative to the actual HEMA crossover. On fast-moving instruments, this can mean a slightly later entry but provides meaningful protection against false transitions.
- BOS detection is based on prior swing highs and lows defined by the swing length parameter. On very low swing length settings, minor highs and lows will be used as structure levels, potentially generating frequent BOS events of less structural significance.
- Z-score impulse requires a sufficient lookback to establish a stable mean and standard deviation for the cumulative streak. In the first Z-lookback bars of any chart, signals may be less statistically reliable as the normalization period is not fully seeded.
- The HEMA and all derivative signals are calculated on the chart's native timeframe. This indicator does not internally pull higher timeframe data — users who want multi-timeframe regime context should reference signals from higher timeframe chart instances.
- Like all trend-following tools, this indicator will produce whipsaw signals in choppy, range-bound markets where neither bulls nor bears sustain momentum long enough to trigger clean regime confirmation.
- Proximity bar coloring uses ATR as a normalizer. During volatility regime shifts (e.g., sudden spike in ATR), the alpha thresholds may temporarily misrepresent proximity distance.
Originality Statement
The Regime & Structure Engine is not a repackaging of any single existing indicator. It is a purpose-built synthesis of methodologies that individually exist in various forms but have not been combined in this specific architecture.
- The HEMA function (Hull-inspired double-weighted EMA followed by square-root-period smoothing) is a custom construction that differs from both standard HMA and standard EMA in its layering approach and final smoothing step.
- The three-state confirmed regime engine with mandatory multi-bar confirmation is an original state machine design. Most indicators display regime as a simple crossover condition; this system enforces a holding period before state transition.
- The Z-score cumulative impulse system measures the statistical significance of a directional streak rather than the magnitude of a single bar move. This normalization approach — accumulating consecutive closes and comparing against rolling sma/stdev — is not a standard oscillator pattern.
- The combination of HEMA-based regime with classical BOS/CHoCH structural analysis on top of Z-score momentum creates a three-dimensional signal framework that no single publicly available indicator replicates.
- The proximity bar coloring system using ATR-normalized distance to the HEMA mid layer as the alpha channel driver is an original visual encoding not found in standard bar coloring implementations.
Disclaimer
The Regime & Structure Engine [JOAT] is provided for educational and informational purposes only. It is a technical analysis tool and does not constitute financial advice. Past behavior of price relative to indicator signals does not guarantee future results. All trading involves risk, including the potential loss of principal. Users are solely responsible for their own trading decisions. Always conduct your own due diligence and consider consulting a licensed financial professional before making any investment decisions.
-Made with passion by officialjackofalltrades
Script de código abierto
Fiel al espíritu de TradingView, el creador de este script lo ha convertido en código abierto, para que los traders puedan revisar y verificar su funcionalidad. ¡Enhorabuena al autor! Aunque puede utilizarlo de forma gratuita, recuerde que cualquier republicación del código está sujeta a nuestras Normas internas.

The Institutional Grade Trading Ecosystem, Built to win trades 📈
Get Access 👇
jackofalltrades.vip 🌐
t.me/jackofalltradesvip 🃏
Get Access 👇
jackofalltrades.vip 🌐
t.me/jackofalltradesvip 🃏
Exención de responsabilidad
La información y las publicaciones no constituyen, ni deben considerarse como, asesoramiento o recomendaciones financieras, de inversión, de trading u otro tipo, proporcionadas o respaldadas por TradingView. Obtenga más información en Condiciones de uso.
Script de código abierto
Fiel al espíritu de TradingView, el creador de este script lo ha convertido en código abierto, para que los traders puedan revisar y verificar su funcionalidad. ¡Enhorabuena al autor! Aunque puede utilizarlo de forma gratuita, recuerde que cualquier republicación del código está sujeta a nuestras Normas internas.
The Institutional Grade Trading Ecosystem, Built to win trades 📈
Get Access 👇
jackofalltrades.vip 🌐
t.me/jackofalltradesvip 🃏
Get Access 👇
jackofalltrades.vip 🌐
t.me/jackofalltradesvip 🃏
Exención de responsabilidad
La información y las publicaciones no constituyen, ni deben considerarse como, asesoramiento o recomendaciones financieras, de inversión, de trading u otro tipo, proporcionadas o respaldadas por TradingView. Obtenga más información en Condiciones de uso.