OPEN-SOURCE SCRIPT
FLOW OSCILLATOR PRO
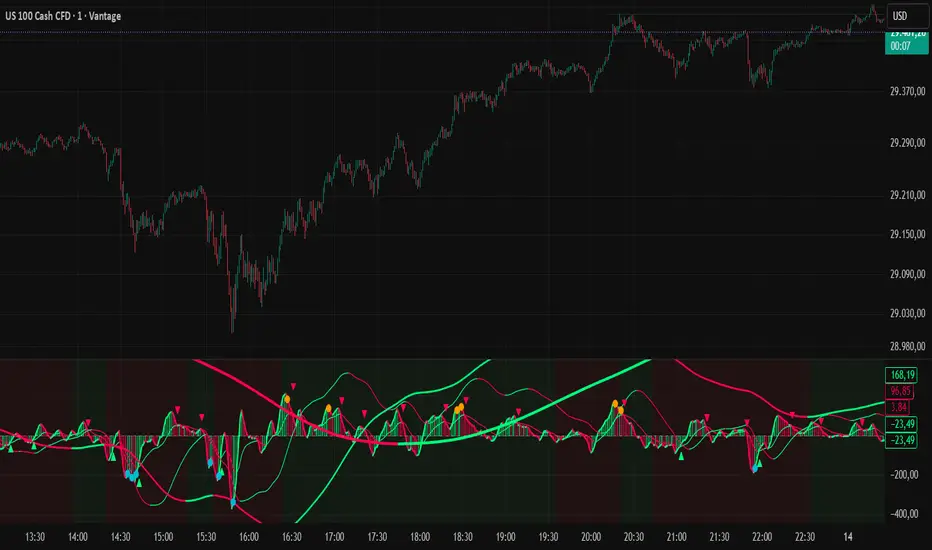
FLOW OSCILLATOR PRO is an advanced institutional momentum oscillator designed to visualize real-time buying and selling pressure across multiple flow layers and higher timeframe trend structures.
Unlike traditional MACD-style oscillators, this indicator uses dynamic flow acceleration and deceleration logic, allowing the histogram to react instantly to momentum shifts — even above or below the zero line.
This creates a much more realistic representation of institutional flow and market pressure.
Perfect for:
NASDAQ
US Indices
Gold (XAUUSD)
Crypto
Scalping
Intraday Momentum Trading
FEATURES
Institutional Flow Histogram
The histogram reacts to real momentum direction:
Neon Green = Momentum rising
Neon Red = Momentum falling
Important:
Histogram can turn RED above zero when bullish momentum weakens
Histogram can turn GREEN below zero when buyers return
This provides significantly earlier momentum detection compared to standard oscillators.
Multi-Timeframe Flow System
The oscillator includes multiple flow layers:
Main Flow
Primary short-term momentum engine.
Signal Flow
Smoothed confirmation flow for crossover signals.
X5 Flow
Higher timeframe momentum projection for trend filtering.
X15 Flow
Mid-to-high timeframe institutional trend structure.
H1 Flow
Slow institutional directional bias and macro momentum.
Dynamic Background Trend Modes
The background color can be switched between multiple trend engines:
Chart Flow
X5 Flow
X15 Flow
H1 Flow
This allows traders to choose how aggressive or stable the trend filter should behave.
Background Colors
Green Background = Bullish higher timeframe pressure
Red Background = Bearish higher timeframe pressure
Smart Buy & Sell Signals
Signals are generated when:
Main Flow crosses Signal Flow
Momentum confirms direction
Flow acceleration supports the move
Signal markers are intentionally positioned further away from the zero line for improved visibility and cleaner chart structure.
Extreme Momentum Detection
The indicator also detects:
Momentum exhaustion
Overextended expansion phases
Potential reversal zones
Colored extreme dots help identify areas where trend pressure may begin slowing down.
HOW TO USE
LONG SETUP
Higher probability long setups occur when:
Histogram turns green
Main Flow crosses above Signal Flow
Background trend is green
X5 / X15 flows align upward
Best used during pullback continuations and momentum expansions.
SHORT SETUP
Higher probability short setups occur when:
Histogram turns red
Main Flow crosses below Signal Flow
Background trend is red
X5 / X15 flows align downward
Best used during breakdowns and bearish momentum acceleration.
COLOR LOGIC
This indicator does NOT use traditional positive/negative MACD coloring.
Instead, colors are based on:
Momentum acceleration
Momentum deceleration
Real flow direction
Flow slope behavior
This creates much earlier and more realistic trend transitions.
BEST SETTINGS
Default settings are optimized for:
NASDAQ M1
Fast intraday momentum trading
Institutional flow tracking
Can also be used for:
Gold scalping
Crypto momentum trading
Futures trading
M5 intraday setups
VISUAL DESIGN
Clean oscillator layout
Smooth institutional flow curves
Dynamic histogram behavior
Multi-timeframe structure
Minimal lag
Fast trend recognition
DISCLAIMER
This indicator is designed as a momentum and flow analysis tool.
Always combine with proper risk management and market structure analysis before trading.
Unlike traditional MACD-style oscillators, this indicator uses dynamic flow acceleration and deceleration logic, allowing the histogram to react instantly to momentum shifts — even above or below the zero line.
This creates a much more realistic representation of institutional flow and market pressure.
Perfect for:
NASDAQ
US Indices
Gold (XAUUSD)
Crypto
Scalping
Intraday Momentum Trading
FEATURES
Institutional Flow Histogram
The histogram reacts to real momentum direction:
Neon Green = Momentum rising
Neon Red = Momentum falling
Important:
Histogram can turn RED above zero when bullish momentum weakens
Histogram can turn GREEN below zero when buyers return
This provides significantly earlier momentum detection compared to standard oscillators.
Multi-Timeframe Flow System
The oscillator includes multiple flow layers:
Main Flow
Primary short-term momentum engine.
Signal Flow
Smoothed confirmation flow for crossover signals.
X5 Flow
Higher timeframe momentum projection for trend filtering.
X15 Flow
Mid-to-high timeframe institutional trend structure.
H1 Flow
Slow institutional directional bias and macro momentum.
Dynamic Background Trend Modes
The background color can be switched between multiple trend engines:
Chart Flow
X5 Flow
X15 Flow
H1 Flow
This allows traders to choose how aggressive or stable the trend filter should behave.
Background Colors
Green Background = Bullish higher timeframe pressure
Red Background = Bearish higher timeframe pressure
Smart Buy & Sell Signals
Signals are generated when:
Main Flow crosses Signal Flow
Momentum confirms direction
Flow acceleration supports the move
Signal markers are intentionally positioned further away from the zero line for improved visibility and cleaner chart structure.
Extreme Momentum Detection
The indicator also detects:
Momentum exhaustion
Overextended expansion phases
Potential reversal zones
Colored extreme dots help identify areas where trend pressure may begin slowing down.
HOW TO USE
LONG SETUP
Higher probability long setups occur when:
Histogram turns green
Main Flow crosses above Signal Flow
Background trend is green
X5 / X15 flows align upward
Best used during pullback continuations and momentum expansions.
SHORT SETUP
Higher probability short setups occur when:
Histogram turns red
Main Flow crosses below Signal Flow
Background trend is red
X5 / X15 flows align downward
Best used during breakdowns and bearish momentum acceleration.
COLOR LOGIC
This indicator does NOT use traditional positive/negative MACD coloring.
Instead, colors are based on:
Momentum acceleration
Momentum deceleration
Real flow direction
Flow slope behavior
This creates much earlier and more realistic trend transitions.
BEST SETTINGS
Default settings are optimized for:
NASDAQ M1
Fast intraday momentum trading
Institutional flow tracking
Can also be used for:
Gold scalping
Crypto momentum trading
Futures trading
M5 intraday setups
VISUAL DESIGN
Clean oscillator layout
Smooth institutional flow curves
Dynamic histogram behavior
Multi-timeframe structure
Minimal lag
Fast trend recognition
DISCLAIMER
This indicator is designed as a momentum and flow analysis tool.
Always combine with proper risk management and market structure analysis before trading.
Script de código abierto
Fiel al espíritu de TradingView, el creador de este script lo ha convertido en código abierto, para que los traders puedan revisar y verificar su funcionalidad. ¡Enhorabuena al autor! Aunque puede utilizarlo de forma gratuita, recuerde que cualquier republicación del código está sujeta a nuestras Normas internas.

Exención de responsabilidad
La información y las publicaciones no constituyen, ni deben considerarse como, asesoramiento o recomendaciones financieras, de inversión, de trading u otro tipo, proporcionadas o respaldadas por TradingView. Obtenga más información en Condiciones de uso.
Script de código abierto
Fiel al espíritu de TradingView, el creador de este script lo ha convertido en código abierto, para que los traders puedan revisar y verificar su funcionalidad. ¡Enhorabuena al autor! Aunque puede utilizarlo de forma gratuita, recuerde que cualquier republicación del código está sujeta a nuestras Normas internas.
Exención de responsabilidad
La información y las publicaciones no constituyen, ni deben considerarse como, asesoramiento o recomendaciones financieras, de inversión, de trading u otro tipo, proporcionadas o respaldadas por TradingView. Obtenga más información en Condiciones de uso.