OPEN-SOURCE SCRIPT
Prime Volume Profile + Liquidity Heatmap
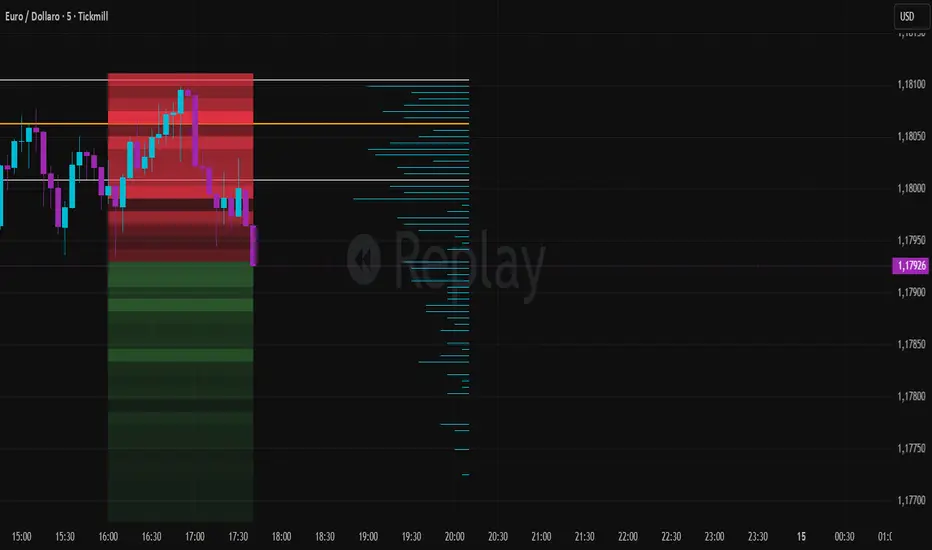
This indicator is designed to provide a clear, institutional-style view of market structure and liquidity distribution, combining a fully customizable Volume Profile with a dynamic Liquidity Heatmap.
It operates on a daily basis, automatically resetting at the start of each new trading day to ensure that all calculations reflect fresh, relevant market data.
🔍 Core Features
• Customizable Volume Profile (Daily)
The indicator builds a high-resolution Volume Profile for the current trading day, allowing traders to visualize where trading activity has been most concentrated.
It highlights three key levels:
POC (Point of Control) – the price level with the highest traded volume during the day. This represents the area where the market has found the strongest agreement between buyers and sellers.
VAH (Value Area High) – the upper boundary of the value area, where approximately 70% of the day’s total volume has been traded.
VAL (Value Area Low) – the lower boundary of the value area, completing the range in which most trading activity has occurred.
These levels are recalculated in real time and reset daily, making them highly relevant for intraday and scalping strategies.
• Liquidity Heatmap
In addition to the volume profile, the indicator provides a visual heatmap of recent liquidity.
Areas with higher intensity represent zones where a significant amount of volume has been transacted.
More transparent zones indicate low participation or “empty” areas in the market.
This allows traders to quickly identify:
Where liquidity is concentrated
Where price is more likely to react
Where inefficiencies or low-interest zones exist
🧠 Understanding Liquidity
In trading, liquidity refers to the amount of buy and sell orders available at specific price levels.
High liquidity zones:
Attract price like a magnet
Often act as support/resistance
Are commonly revisited by the market
Low liquidity zones:
Allow price to move quickly
Often result in sharp, impulsive moves
Understanding liquidity helps traders interpret why price moves, not just where it moves.
⚙️ How to Use This Indicator
This tool is best used as a confirmation layer within a broader trading strategy.
Common use cases:
POC as a magnet
Price often gravitates toward the Point of Control. Traders monitor reactions around this level for mean reversion or continuation setups.
VAH / VAL as reaction zones
These levels can act as dynamic support and resistance.
Breakouts or rejections around these zones can signal potential trade opportunities.
Heatmap for execution timing
Use the liquidity heatmap to identify:
High-interest zones for entries or exits
Low-liquidity areas where price may move quickly
⚠️ Important Disclaimer
This indicator is not financial advice and does not provide direct buy or sell signals.
It is intended to be used as a decision-support tool, ideally in combination with:
Price action analysis
Market structure
Other indicators or trading strategies
🎯 Summary
This indicator gives you a real-time map of market participation, helping you understand:
Where volume is concentrated
Where liquidity is sitting
Where price is likely to react
Used correctly, it provides a significant informational edge, especially for intraday and short-term traders.
It operates on a daily basis, automatically resetting at the start of each new trading day to ensure that all calculations reflect fresh, relevant market data.
🔍 Core Features
• Customizable Volume Profile (Daily)
The indicator builds a high-resolution Volume Profile for the current trading day, allowing traders to visualize where trading activity has been most concentrated.
It highlights three key levels:
POC (Point of Control) – the price level with the highest traded volume during the day. This represents the area where the market has found the strongest agreement between buyers and sellers.
VAH (Value Area High) – the upper boundary of the value area, where approximately 70% of the day’s total volume has been traded.
VAL (Value Area Low) – the lower boundary of the value area, completing the range in which most trading activity has occurred.
These levels are recalculated in real time and reset daily, making them highly relevant for intraday and scalping strategies.
• Liquidity Heatmap
In addition to the volume profile, the indicator provides a visual heatmap of recent liquidity.
Areas with higher intensity represent zones where a significant amount of volume has been transacted.
More transparent zones indicate low participation or “empty” areas in the market.
This allows traders to quickly identify:
Where liquidity is concentrated
Where price is more likely to react
Where inefficiencies or low-interest zones exist
🧠 Understanding Liquidity
In trading, liquidity refers to the amount of buy and sell orders available at specific price levels.
High liquidity zones:
Attract price like a magnet
Often act as support/resistance
Are commonly revisited by the market
Low liquidity zones:
Allow price to move quickly
Often result in sharp, impulsive moves
Understanding liquidity helps traders interpret why price moves, not just where it moves.
⚙️ How to Use This Indicator
This tool is best used as a confirmation layer within a broader trading strategy.
Common use cases:
POC as a magnet
Price often gravitates toward the Point of Control. Traders monitor reactions around this level for mean reversion or continuation setups.
VAH / VAL as reaction zones
These levels can act as dynamic support and resistance.
Breakouts or rejections around these zones can signal potential trade opportunities.
Heatmap for execution timing
Use the liquidity heatmap to identify:
High-interest zones for entries or exits
Low-liquidity areas where price may move quickly
⚠️ Important Disclaimer
This indicator is not financial advice and does not provide direct buy or sell signals.
It is intended to be used as a decision-support tool, ideally in combination with:
Price action analysis
Market structure
Other indicators or trading strategies
🎯 Summary
This indicator gives you a real-time map of market participation, helping you understand:
Where volume is concentrated
Where liquidity is sitting
Where price is likely to react
Used correctly, it provides a significant informational edge, especially for intraday and short-term traders.
Script de código abierto
Fiel al espíritu de TradingView, el creador de este script lo ha convertido en código abierto, para que los traders puedan revisar y verificar su funcionalidad. ¡Enhorabuena al autor! Aunque puede utilizarlo de forma gratuita, recuerde que cualquier republicación del código está sujeta a nuestras Normas internas.

Prime Signals
Exención de responsabilidad
La información y las publicaciones no constituyen, ni deben considerarse como, asesoramiento o recomendaciones financieras, de inversión, de trading u otro tipo, proporcionadas o respaldadas por TradingView. Obtenga más información en Condiciones de uso.
Script de código abierto
Fiel al espíritu de TradingView, el creador de este script lo ha convertido en código abierto, para que los traders puedan revisar y verificar su funcionalidad. ¡Enhorabuena al autor! Aunque puede utilizarlo de forma gratuita, recuerde que cualquier republicación del código está sujeta a nuestras Normas internas.
Prime Signals
Exención de responsabilidad
La información y las publicaciones no constituyen, ni deben considerarse como, asesoramiento o recomendaciones financieras, de inversión, de trading u otro tipo, proporcionadas o respaldadas por TradingView. Obtenga más información en Condiciones de uso.