OPEN-SOURCE SCRIPT
GLI Trend Analysis | Astral Vision
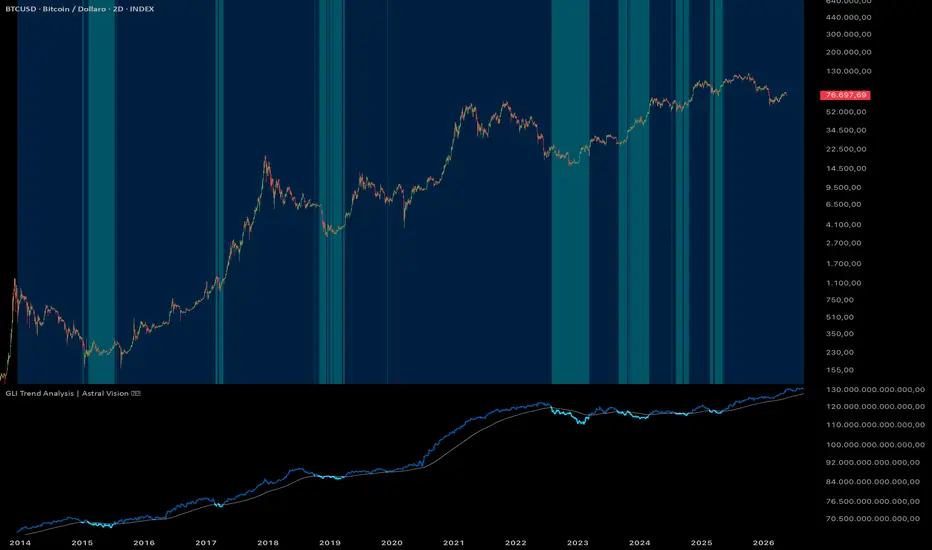
GLI Trend Analysis | Astral Vision 🌠💠
This indicator plots the Global Liquidity Index and its exponential moving average, using the EMA crossover as a directional trend signal for the global monetary environment. The GLI is constructed from the same comprehensive 21-source aggregation used across the Astral Vision liquidity suite: 17 major central bank balance sheets converted to USD via live FX rates, minus the Fed's non-stimulative liabilities (Reverse Repo Facility and Treasury General Account), plus M2 money supply for the US, EU, China, and Japan.
Calculation ⚙️
The GLI is computed as:
Fed balance sheet, minus RRP (Reverse Repo: overnight cash parked at the Fed by money market funds, which drains liquidity from the financial system), minus TGA (Treasury General Account: the US government's cash balance at the Fed, which also drains liquidity when it grows), plus the balance sheets of the Bank of Japan, People's Bank of China, Bank of England, ECB, Reserve Bank of India, Bank of Canada, Reserve Bank of Australia, Swiss National Bank, Central Bank of Russia, Central Bank of Brazil, Bank of Korea, Reserve Bank of New Zealand, Sveriges Riksbank, and Bank Negara Malaysia, each converted to USD by multiplying by the corresponding live FX rate, plus M2 money supply for the US, EU (converted via EURUSD), China (converted via CNYUSD), and Japan (converted via JPYUSD).
The subtraction of RRP and TGA from the Fed balance sheet is a critical correction absent from simpler GLI implementations. The Fed's balance sheet includes liabilities that do not actually inject money into the financial system: when RRP balances are high, money market funds are lending cash back to the Fed overnight, effectively withdrawing it from circulation. Similarly, a growing TGA means the government is holding more cash at the Fed rather than spending it into the economy. Subtracting both produces a more accurate measure of net liquidity actually available to financial markets.
An EMA of configurable length is applied to the resulting GLI series. When GLI is above its EMA, global liquidity is in an uptrend relative to its own smoothed baseline, historically associated with expanding risk appetite and upward pressure on Bitcoin and other risk assets. When GLI is below its EMA, the trend is contractionary.
Both the GLI line and the background color on the price chart are shifted forward in time by a configurable offset in bars, operationalizing the empirically documented lead-lag relationship between global liquidity inflections and Bitcoin price response.
Plots 📊
Inputs 🎛️
Colors 🎨
5 Astral Vision presets + custom override. Default: Infinito.
Purpose 🎯
A standard EMA crossover applied to Bitcoin price measures Bitcoin's own momentum without any external reference. This indicator applies the same crossover logic to global central bank liquidity, producing a regime signal that is causally upstream of Bitcoin price rather than derived from it. The forward shift separates this tool from coincident liquidity indicators by explicitly positioning the signal as a leading reference, reflecting the time lag between liquidity creation and its transmission into asset prices. The RRP and TGA correction further distinguishes it from simpler GLI charts available elsewhere, which overstate liquidity by including Fed liabilities that do not reach financial markets.
Disclaimer ⭕️
This indicator is for informational and educational purposes only. It does not constitute financial advice. Past performance is not indicative of future results. Always do your own research before making investment decisions.
This indicator plots the Global Liquidity Index and its exponential moving average, using the EMA crossover as a directional trend signal for the global monetary environment. The GLI is constructed from the same comprehensive 21-source aggregation used across the Astral Vision liquidity suite: 17 major central bank balance sheets converted to USD via live FX rates, minus the Fed's non-stimulative liabilities (Reverse Repo Facility and Treasury General Account), plus M2 money supply for the US, EU, China, and Japan.
Calculation ⚙️
The GLI is computed as:
Fed balance sheet, minus RRP (Reverse Repo: overnight cash parked at the Fed by money market funds, which drains liquidity from the financial system), minus TGA (Treasury General Account: the US government's cash balance at the Fed, which also drains liquidity when it grows), plus the balance sheets of the Bank of Japan, People's Bank of China, Bank of England, ECB, Reserve Bank of India, Bank of Canada, Reserve Bank of Australia, Swiss National Bank, Central Bank of Russia, Central Bank of Brazil, Bank of Korea, Reserve Bank of New Zealand, Sveriges Riksbank, and Bank Negara Malaysia, each converted to USD by multiplying by the corresponding live FX rate, plus M2 money supply for the US, EU (converted via EURUSD), China (converted via CNYUSD), and Japan (converted via JPYUSD).
The subtraction of RRP and TGA from the Fed balance sheet is a critical correction absent from simpler GLI implementations. The Fed's balance sheet includes liabilities that do not actually inject money into the financial system: when RRP balances are high, money market funds are lending cash back to the Fed overnight, effectively withdrawing it from circulation. Similarly, a growing TGA means the government is holding more cash at the Fed rather than spending it into the economy. Subtracting both produces a more accurate measure of net liquidity actually available to financial markets.
An EMA of configurable length is applied to the resulting GLI series. When GLI is above its EMA, global liquidity is in an uptrend relative to its own smoothed baseline, historically associated with expanding risk appetite and upward pressure on Bitcoin and other risk assets. When GLI is below its EMA, the trend is contractionary.
Both the GLI line and the background color on the price chart are shifted forward in time by a configurable offset in bars, operationalizing the empirically documented lead-lag relationship between global liquidity inflections and Bitcoin price response.
Plots 📊
- GLI line colored by its position relative to the EMA, shifted forward by the configurable offset
- EMA line as a neutral reference
- Background color on the price chart reflecting GLI trend direction, shifted forward by the same offset
Inputs 🎛️
- EMA Length: smoothing period for the GLI trend baseline
- Lead Offset: bars to shift both the GLI signal and the background color forward in time
Colors 🎨
5 Astral Vision presets + custom override. Default: Infinito.
Purpose 🎯
A standard EMA crossover applied to Bitcoin price measures Bitcoin's own momentum without any external reference. This indicator applies the same crossover logic to global central bank liquidity, producing a regime signal that is causally upstream of Bitcoin price rather than derived from it. The forward shift separates this tool from coincident liquidity indicators by explicitly positioning the signal as a leading reference, reflecting the time lag between liquidity creation and its transmission into asset prices. The RRP and TGA correction further distinguishes it from simpler GLI charts available elsewhere, which overstate liquidity by including Fed liabilities that do not reach financial markets.
Disclaimer ⭕️
This indicator is for informational and educational purposes only. It does not constitute financial advice. Past performance is not indicative of future results. Always do your own research before making investment decisions.
Script de código abierto
Fiel al espíritu de TradingView, el creador de este script lo ha convertido en código abierto, para que los traders puedan revisar y verificar su funcionalidad. ¡Enhorabuena al autor! Aunque puede utilizarlo de forma gratuita, recuerde que cualquier republicación del código está sujeta a nuestras Normas internas.

My premium indicators are available on Whop:
whop.com/astralvision
Astral Vision 🌠💠
whop.com/astralvision
Astral Vision 🌠💠
Exención de responsabilidad
La información y las publicaciones no constituyen, ni deben considerarse como, asesoramiento o recomendaciones financieras, de inversión, de trading u otro tipo, proporcionadas o respaldadas por TradingView. Obtenga más información en Condiciones de uso.
Script de código abierto
Fiel al espíritu de TradingView, el creador de este script lo ha convertido en código abierto, para que los traders puedan revisar y verificar su funcionalidad. ¡Enhorabuena al autor! Aunque puede utilizarlo de forma gratuita, recuerde que cualquier republicación del código está sujeta a nuestras Normas internas.
My premium indicators are available on Whop:
whop.com/astralvision
Astral Vision 🌠💠
whop.com/astralvision
Astral Vision 🌠💠
Exención de responsabilidad
La información y las publicaciones no constituyen, ni deben considerarse como, asesoramiento o recomendaciones financieras, de inversión, de trading u otro tipo, proporcionadas o respaldadas por TradingView. Obtenga más información en Condiciones de uso.