OPEN-SOURCE SCRIPT
SPX | ES | SPY | NQ | QQQ Converter by TenAMTrader
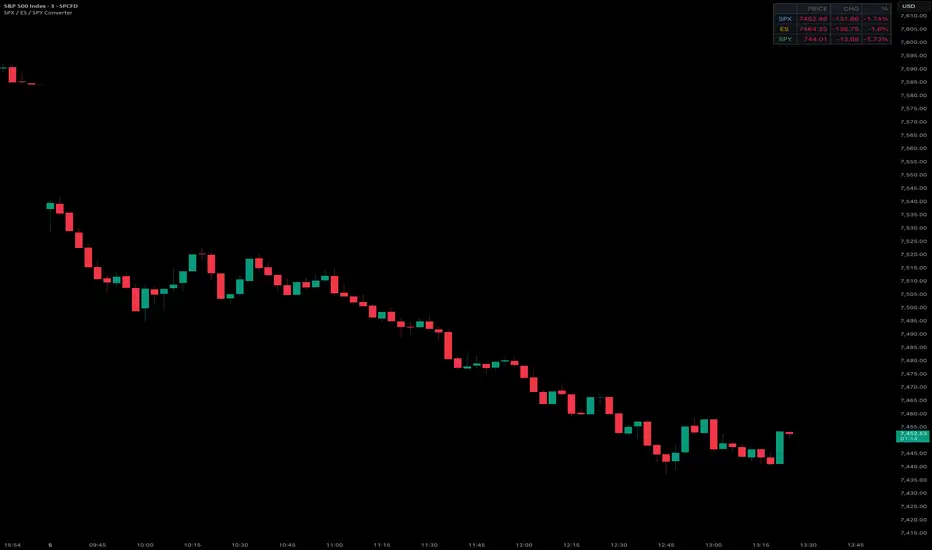
SPX | ES | SPY | NQ | QQQ Converter by TenAMTrader
A lightweight overlay table that displays real-time price, point change, and percentage change for your key S&P 500 and Nasdaq instruments — all in one glance, right on your chart.
Built to sit cleanly at the top of your SPX chart without cluttering your view. All instruments are pulled from the daily timeframe so change values always reflect the true day's move, regardless of what intraday timeframe your chart is set to.
Always displayed:
SPX (S&P 500 Index)
ES (E-mini S&P 500 Futures)
SPY (S&P 500 ETF)
Optional — toggle on/off in settings:
NQ (E-mini Nasdaq 100 Futures)
QQQ (Nasdaq 100 ETF)
Each row shows:
Live price
Point change vs. prior day's close
Percentage change vs. prior day's close
Color coded green/red on all values for instant readability. Designed for traders who need quick cross-instrument reference without switching charts or windows.
Settings:
Position — Top Right / Top Left / Top Center
Text Size — Tiny / Small / Normal / Large
Instruments — Toggle NQ and QQQ on or off (default off)
This script is for informational purposes only and does not constitute financial advice. All data is provided as-is with no guarantee of accuracy or timeliness. Past performance is not indicative of future results. Trading involves substantial risk of loss and is not suitable for all investors. The author assumes no liability for any trading decisions made based on this tool. Always do your own research and consult a qualified financial advisor before making any investment decisions.
A lightweight overlay table that displays real-time price, point change, and percentage change for your key S&P 500 and Nasdaq instruments — all in one glance, right on your chart.
Built to sit cleanly at the top of your SPX chart without cluttering your view. All instruments are pulled from the daily timeframe so change values always reflect the true day's move, regardless of what intraday timeframe your chart is set to.
Always displayed:
SPX (S&P 500 Index)
ES (E-mini S&P 500 Futures)
SPY (S&P 500 ETF)
Optional — toggle on/off in settings:
NQ (E-mini Nasdaq 100 Futures)
QQQ (Nasdaq 100 ETF)
Each row shows:
Live price
Point change vs. prior day's close
Percentage change vs. prior day's close
Color coded green/red on all values for instant readability. Designed for traders who need quick cross-instrument reference without switching charts or windows.
Settings:
Position — Top Right / Top Left / Top Center
Text Size — Tiny / Small / Normal / Large
Instruments — Toggle NQ and QQQ on or off (default off)
This script is for informational purposes only and does not constitute financial advice. All data is provided as-is with no guarantee of accuracy or timeliness. Past performance is not indicative of future results. Trading involves substantial risk of loss and is not suitable for all investors. The author assumes no liability for any trading decisions made based on this tool. Always do your own research and consult a qualified financial advisor before making any investment decisions.
Script de código abierto
Fiel al espíritu de TradingView, el creador de este script lo ha convertido en código abierto, para que los traders puedan revisar y verificar su funcionalidad. ¡Enhorabuena al autor! Aunque puede utilizarlo de forma gratuita, recuerde que cualquier republicación del código está sujeta a nuestras Normas internas.

Exención de responsabilidad
La información y las publicaciones no constituyen, ni deben considerarse como, asesoramiento o recomendaciones financieras, de inversión, de trading u otro tipo, proporcionadas o respaldadas por TradingView. Obtenga más información en Condiciones de uso.
Script de código abierto
Fiel al espíritu de TradingView, el creador de este script lo ha convertido en código abierto, para que los traders puedan revisar y verificar su funcionalidad. ¡Enhorabuena al autor! Aunque puede utilizarlo de forma gratuita, recuerde que cualquier republicación del código está sujeta a nuestras Normas internas.
Exención de responsabilidad
La información y las publicaciones no constituyen, ni deben considerarse como, asesoramiento o recomendaciones financieras, de inversión, de trading u otro tipo, proporcionadas o respaldadas por TradingView. Obtenga más información en Condiciones de uso.