OPEN-SOURCE SCRIPT
Normalized Coefficient of Variation
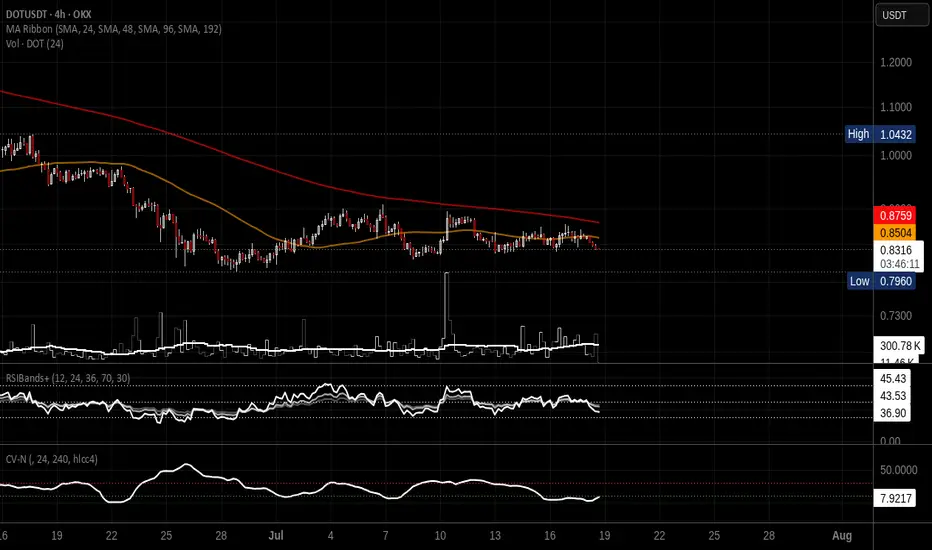
# Normalized Coefficient of Variation (CV)
This indicator measures market volatility using the **Coefficient of Variation (CV)**, defined as the ratio of the standard deviation to the simple moving average (SMA), expressed as a percentage.
Unlike the traditional CV, which has no upper limit and can vary significantly across different assets and market conditions, this indicator applies a **Rolling Min-Max Normalization** over a user-defined lookback period. The result is a dynamic oscillator scaled between **0 and 100**, making it easier to compare relative volatility across different symbols and timeframes.
## Formula
**Coefficient of Variation**
CV = (Standard Deviation / SMA) × 100
**Normalization**
Normalized CV = 100 × (CV − Lowest CV) / (Highest CV − Lowest CV)
where the lowest and highest CV values are calculated over the selected normalization lookback period.
## Features
* Rolling Min-Max normalization (0-100 scale)
* User-selectable calculation timeframe
* Adjustable CV period (default: 24)
* Adjustable normalization lookback (default: 250)
* Uses Simple Moving Average (SMA)
* White oscillator line for clear visualization
* Dotted reference levels at 10 and 30
* Hidden raw CV value available in the Data Window
## Interpretation
* Values below **10** indicate relatively low volatility compared to recent history.
* Values above **30** indicate relatively high volatility compared to recent history.
* Values approaching **100** represent the highest relative volatility observed within the selected normalization window.
* Values approaching **0** represent the lowest relative volatility observed within the selected normalization window.
Because the indicator is normalized, the displayed values represent **relative volatility within the selected lookback period**, not the absolute Coefficient of Variation percentage. This makes the indicator especially useful for comparing changing volatility regimes across different markets and timeframes.
This indicator is intended as a volatility analysis tool and should be used alongside price action and other technical indicators rather than as a standalone trading signal.
This indicator measures market volatility using the **Coefficient of Variation (CV)**, defined as the ratio of the standard deviation to the simple moving average (SMA), expressed as a percentage.
Unlike the traditional CV, which has no upper limit and can vary significantly across different assets and market conditions, this indicator applies a **Rolling Min-Max Normalization** over a user-defined lookback period. The result is a dynamic oscillator scaled between **0 and 100**, making it easier to compare relative volatility across different symbols and timeframes.
## Formula
**Coefficient of Variation**
CV = (Standard Deviation / SMA) × 100
**Normalization**
Normalized CV = 100 × (CV − Lowest CV) / (Highest CV − Lowest CV)
where the lowest and highest CV values are calculated over the selected normalization lookback period.
## Features
* Rolling Min-Max normalization (0-100 scale)
* User-selectable calculation timeframe
* Adjustable CV period (default: 24)
* Adjustable normalization lookback (default: 250)
* Uses Simple Moving Average (SMA)
* White oscillator line for clear visualization
* Dotted reference levels at 10 and 30
* Hidden raw CV value available in the Data Window
## Interpretation
* Values below **10** indicate relatively low volatility compared to recent history.
* Values above **30** indicate relatively high volatility compared to recent history.
* Values approaching **100** represent the highest relative volatility observed within the selected normalization window.
* Values approaching **0** represent the lowest relative volatility observed within the selected normalization window.
Because the indicator is normalized, the displayed values represent **relative volatility within the selected lookback period**, not the absolute Coefficient of Variation percentage. This makes the indicator especially useful for comparing changing volatility regimes across different markets and timeframes.
This indicator is intended as a volatility analysis tool and should be used alongside price action and other technical indicators rather than as a standalone trading signal.
Script de código abierto
Fiel al espíritu de TradingView, el creador de este script lo ha convertido en código abierto, para que los traders puedan revisar y verificar su funcionalidad. ¡Enhorabuena al autor! Aunque puede utilizarlo de forma gratuita, recuerde que cualquier republicación del código está sujeta a nuestras Normas internas.

Exención de responsabilidad
La información y las publicaciones no constituyen, ni deben considerarse como, asesoramiento o recomendaciones financieras, de inversión, de trading u otro tipo, proporcionadas o respaldadas por TradingView. Obtenga más información en Condiciones de uso.
Script de código abierto
Fiel al espíritu de TradingView, el creador de este script lo ha convertido en código abierto, para que los traders puedan revisar y verificar su funcionalidad. ¡Enhorabuena al autor! Aunque puede utilizarlo de forma gratuita, recuerde que cualquier republicación del código está sujeta a nuestras Normas internas.
Exención de responsabilidad
La información y las publicaciones no constituyen, ni deben considerarse como, asesoramiento o recomendaciones financieras, de inversión, de trading u otro tipo, proporcionadas o respaldadas por TradingView. Obtenga más información en Condiciones de uso.