OPEN-SOURCE SCRIPT
Multi-Timeframe Confluence System [forexobroker]
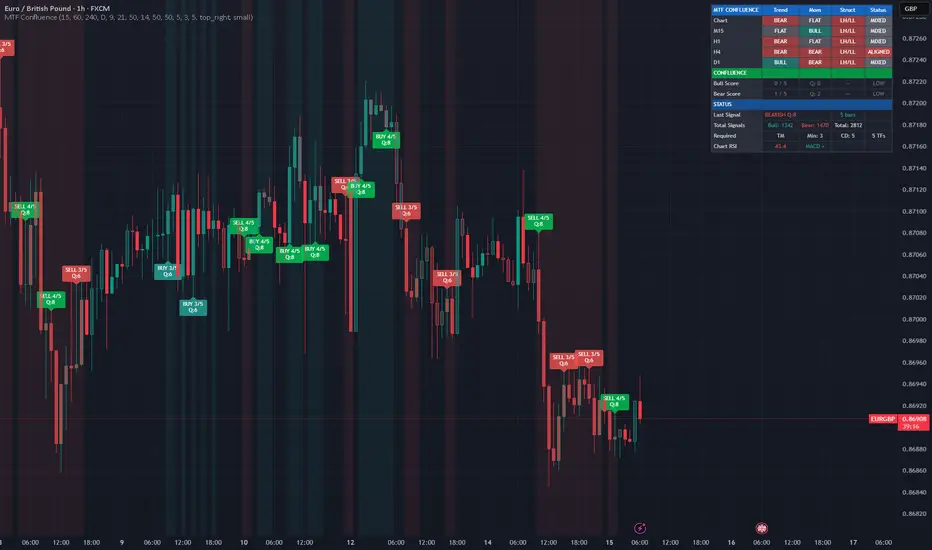
Multi-Timeframe Confluence System eliminates low-probability trades by requiring agreement across multiple timeframes before generating any signal. It checks three dimensions — trend direction, momentum state, and market structure — on each of 4 configurable higher timeframes plus your current chart, then fires signals only when your defined confluence threshold is met.
THE PROBLEM WITH SINGLE-TIMEFRAME TRADING
Most traders make decisions based on one timeframe. This leads to three common problems:
False Signals — A bullish setup on the 15-minute chart means nothing if the 4-hour and daily are bearish. Without multi-timeframe confirmation, you're trading against the bigger picture.
Low Win Rate — Studies consistently show that trades aligned with higher timeframe trends have significantly higher win rates. Single-timeframe setups ignore this edge entirely.
Manual Checking — Serious traders already check multiple timeframes before entering. But doing this manually is slow, subjective, and inconsistent. You might check 3 timeframes on one trade but forget on the next.
Multi-Timeframe Confluence System automates and systematizes this process. Every bar, every timeframe, every dimension — checked algorithmically, scored objectively.
HOW IT WORKS
The system analyzes three dimensions on each timeframe:
1. Trend Direction
Using a triple EMA system (Fast 9, Slow 21, Trend 50):
Bullish: Fast EMA > Slow EMA AND price > Trend EMA
Bearish: Fast EMA < Slow EMA AND price < Trend EMA
Neutral: Mixed conditions
This captures both short-term direction (fast/slow cross) and longer-term context (price vs trend EMA).
2. Momentum State
Using RSI (14) with optional MACD histogram confirmation:
Bullish Momentum: RSI above the bull threshold (default 50) AND MACD histogram positive
Bearish Momentum: RSI below the bear threshold (default 50) AND MACD histogram negative
Neutral: RSI in no-man's land or MACD contradicts RSI
MACD confirmation is optional but recommended — it filters out weak RSI readings.
3. Market Structure
Using swing point analysis (pivothigh/pivotlow):
Bullish Structure: Higher highs AND higher lows (HH/HL)
Bearish Structure: Lower highs AND lower lows (LH/LL)
Mixed: No clear structural pattern
Structure is the most reliable but slowest-moving dimension. It confirms that the price action pattern supports the direction.
CONFLUENCE SCORING
Each enabled timeframe contributes 1 point to the bull or bear confluence score if its required conditions are met.
With all 5 timeframes enabled (chart + 4 HTFs):
5/5: Perfect alignment — highest probability setup
4/5: Strong alignment — high probability
3/5: Moderate alignment — standard signal (default minimum)
2/5: Weak alignment — consider skipping
1/5 or 0/5: No alignment — no signal
Quality Score (1-10): Confluence count divided by enabled TFs, scaled to 10. A score of 8+ means near-perfect alignment across all checked timeframes.
CONFIGURABLE REQUIREMENTS
You control which dimensions must align for each TF to count:
Setting Effect When ON Effect When OFF
Require Trend TF's EMA trend must match direction Trend ignored, only other factors count
Require Momentum TF's RSI/MACD must match direction Momentum ignored
Require Structure TF's swing structure must match direction Structure ignored (recommended for beginners)
Default: Trend + Momentum required, Structure optional. This provides a good balance of signal quality vs frequency.
SIGNAL GENERATION
Signals fire when:
Bull or bear confluence meets your minimum threshold
The cooldown period has elapsed since the last same-direction signal
The bar is confirmed (no repainting)
Signal labels show:
Direction (BUY/SELL)
Confluence count (e.g., "4/5")
Quality score (e.g., "Q:8")
DASHBOARD
The dashboard provides a complete multi-timeframe overview:
Section Shows
TF Grid Each timeframe's Trend/Momentum/Structure status with color coding
Bull Score Bullish confluence count, quality, and signal state
Bear Score Bearish confluence count, quality, and signal state
Last Signal Direction, quality, and bars since last signal
Total Signals Running bull/bear signal counts
Settings Active requirements (T/M/S), minimum confluence, cooldown
Chart RSI Current RSI value and MACD direction
Each TF row shows BULL/BEAR/FLAT for trend, momentum, and structure, with ALIGNED/MIXED status.
FEATURES
4 configurable higher timeframes + current chart timeframe
Triple EMA trend detection (9/21/50)
RSI momentum with optional MACD histogram confirmation
Swing-based market structure analysis (HH/HL vs LH/LL)
Confluence scoring with configurable minimum threshold
Quality score 1-10 for signal strength assessment
Customizable requirements (trend/momentum/structure toggles)
Signal cooldown to prevent clustering
BUY/SELL labels with confluence count and quality
Bar coloring by confluence strength
Background shading when confluence threshold met
5-column dashboard with per-TF breakdown
Theme-aware colors for light and dark charts
Data Window integration for all metrics
Only 4 request.security() calls (well within 40 limit)
barstate.isconfirmed on all signals — no repainting
6 alert conditions including full alignment alerts
Works on any instrument and timeframe
ALERTS
Alert Fires When
Bullish Confluence Signal Bull confluence meets minimum threshold
Bearish Confluence Signal Bear confluence meets minimum threshold
High Quality Signal Signal with quality score 8+
Any Confluence Signal Any bull or bear signal
Full Bull Alignment ALL enabled timeframes bullish
Full Bear Alignment ALL enabled timeframes bearish
USE CASES
Trend Following — Set TFs to 15m/1H/4H/Daily. Require trend + momentum. Wait for 4/5+ confluence before entering in the trend direction. This filters out counter-trend noise.
Swing Entry Timing — Use daily trend as your bias, then wait for the 15m/1H to align for precise entry timing. The system tells you exactly when all your timeframes agree.
Signal Filtering — Combine with other indicators as a filter. Only take signals from your primary indicator when MTF Confluence shows 3+ aligned timeframes.
Session Trading — Set your 4 TFs to cover intraday through daily. Only trade during sessions where confluence is high. The background shading makes alignment visually obvious.
Position Sizing — Use the quality score to size positions: full size on Q:8+, half size on Q:6-7, skip trades below Q:6.
SETTINGS OVERVIEW
Timeframes: Enable/disable each of 4 HTFs with configurable timeframe selection.
Trend Detection: Fast EMA, Slow EMA, Trend EMA lengths.
Momentum: RSI length, bull/bear thresholds, MACD confirmation toggle.
Structure: Swing pivot lookback length.
Confluence: Minimum confluence count, required dimensions (trend/momentum/structure toggles), signal cooldown bars.
Display: Signal labels, bar colors, background zones, dashboard, table position, text size.
Colors: Bullish, bearish, strong signal, weak signal, neutral.
TECHNICAL NOTES
Only 4 request.security() calls using tuple syntax — returns trend, momentum, structure, strength, RSI, and MACD per call
All analysis via f_analyze() function called on each timeframe
barmerge.lookahead_off on all security calls
Signals only on barstate.isconfirmed
Cooldown prevents signal clustering
Structure uses ta.pivothigh/pivotlow with confirmation delay
Dashboard renders on barstate.islast only
DISCLAIMER
This indicator is for educational and informational purposes only. It does not constitute financial advice. Multi-timeframe confluence increases probability but does not guarantee outcomes. Higher timeframe data is subject to the limitations of TradingView's request.security() function. Always use proper risk management. Past performance does not guarantee future results.
THE PROBLEM WITH SINGLE-TIMEFRAME TRADING
Most traders make decisions based on one timeframe. This leads to three common problems:
False Signals — A bullish setup on the 15-minute chart means nothing if the 4-hour and daily are bearish. Without multi-timeframe confirmation, you're trading against the bigger picture.
Low Win Rate — Studies consistently show that trades aligned with higher timeframe trends have significantly higher win rates. Single-timeframe setups ignore this edge entirely.
Manual Checking — Serious traders already check multiple timeframes before entering. But doing this manually is slow, subjective, and inconsistent. You might check 3 timeframes on one trade but forget on the next.
Multi-Timeframe Confluence System automates and systematizes this process. Every bar, every timeframe, every dimension — checked algorithmically, scored objectively.
HOW IT WORKS
The system analyzes three dimensions on each timeframe:
1. Trend Direction
Using a triple EMA system (Fast 9, Slow 21, Trend 50):
Bullish: Fast EMA > Slow EMA AND price > Trend EMA
Bearish: Fast EMA < Slow EMA AND price < Trend EMA
Neutral: Mixed conditions
This captures both short-term direction (fast/slow cross) and longer-term context (price vs trend EMA).
2. Momentum State
Using RSI (14) with optional MACD histogram confirmation:
Bullish Momentum: RSI above the bull threshold (default 50) AND MACD histogram positive
Bearish Momentum: RSI below the bear threshold (default 50) AND MACD histogram negative
Neutral: RSI in no-man's land or MACD contradicts RSI
MACD confirmation is optional but recommended — it filters out weak RSI readings.
3. Market Structure
Using swing point analysis (pivothigh/pivotlow):
Bullish Structure: Higher highs AND higher lows (HH/HL)
Bearish Structure: Lower highs AND lower lows (LH/LL)
Mixed: No clear structural pattern
Structure is the most reliable but slowest-moving dimension. It confirms that the price action pattern supports the direction.
CONFLUENCE SCORING
Each enabled timeframe contributes 1 point to the bull or bear confluence score if its required conditions are met.
With all 5 timeframes enabled (chart + 4 HTFs):
5/5: Perfect alignment — highest probability setup
4/5: Strong alignment — high probability
3/5: Moderate alignment — standard signal (default minimum)
2/5: Weak alignment — consider skipping
1/5 or 0/5: No alignment — no signal
Quality Score (1-10): Confluence count divided by enabled TFs, scaled to 10. A score of 8+ means near-perfect alignment across all checked timeframes.
CONFIGURABLE REQUIREMENTS
You control which dimensions must align for each TF to count:
Setting Effect When ON Effect When OFF
Require Trend TF's EMA trend must match direction Trend ignored, only other factors count
Require Momentum TF's RSI/MACD must match direction Momentum ignored
Require Structure TF's swing structure must match direction Structure ignored (recommended for beginners)
Default: Trend + Momentum required, Structure optional. This provides a good balance of signal quality vs frequency.
SIGNAL GENERATION
Signals fire when:
Bull or bear confluence meets your minimum threshold
The cooldown period has elapsed since the last same-direction signal
The bar is confirmed (no repainting)
Signal labels show:
Direction (BUY/SELL)
Confluence count (e.g., "4/5")
Quality score (e.g., "Q:8")
DASHBOARD
The dashboard provides a complete multi-timeframe overview:
Section Shows
TF Grid Each timeframe's Trend/Momentum/Structure status with color coding
Bull Score Bullish confluence count, quality, and signal state
Bear Score Bearish confluence count, quality, and signal state
Last Signal Direction, quality, and bars since last signal
Total Signals Running bull/bear signal counts
Settings Active requirements (T/M/S), minimum confluence, cooldown
Chart RSI Current RSI value and MACD direction
Each TF row shows BULL/BEAR/FLAT for trend, momentum, and structure, with ALIGNED/MIXED status.
FEATURES
4 configurable higher timeframes + current chart timeframe
Triple EMA trend detection (9/21/50)
RSI momentum with optional MACD histogram confirmation
Swing-based market structure analysis (HH/HL vs LH/LL)
Confluence scoring with configurable minimum threshold
Quality score 1-10 for signal strength assessment
Customizable requirements (trend/momentum/structure toggles)
Signal cooldown to prevent clustering
BUY/SELL labels with confluence count and quality
Bar coloring by confluence strength
Background shading when confluence threshold met
5-column dashboard with per-TF breakdown
Theme-aware colors for light and dark charts
Data Window integration for all metrics
Only 4 request.security() calls (well within 40 limit)
barstate.isconfirmed on all signals — no repainting
6 alert conditions including full alignment alerts
Works on any instrument and timeframe
ALERTS
Alert Fires When
Bullish Confluence Signal Bull confluence meets minimum threshold
Bearish Confluence Signal Bear confluence meets minimum threshold
High Quality Signal Signal with quality score 8+
Any Confluence Signal Any bull or bear signal
Full Bull Alignment ALL enabled timeframes bullish
Full Bear Alignment ALL enabled timeframes bearish
USE CASES
Trend Following — Set TFs to 15m/1H/4H/Daily. Require trend + momentum. Wait for 4/5+ confluence before entering in the trend direction. This filters out counter-trend noise.
Swing Entry Timing — Use daily trend as your bias, then wait for the 15m/1H to align for precise entry timing. The system tells you exactly when all your timeframes agree.
Signal Filtering — Combine with other indicators as a filter. Only take signals from your primary indicator when MTF Confluence shows 3+ aligned timeframes.
Session Trading — Set your 4 TFs to cover intraday through daily. Only trade during sessions where confluence is high. The background shading makes alignment visually obvious.
Position Sizing — Use the quality score to size positions: full size on Q:8+, half size on Q:6-7, skip trades below Q:6.
SETTINGS OVERVIEW
Timeframes: Enable/disable each of 4 HTFs with configurable timeframe selection.
Trend Detection: Fast EMA, Slow EMA, Trend EMA lengths.
Momentum: RSI length, bull/bear thresholds, MACD confirmation toggle.
Structure: Swing pivot lookback length.
Confluence: Minimum confluence count, required dimensions (trend/momentum/structure toggles), signal cooldown bars.
Display: Signal labels, bar colors, background zones, dashboard, table position, text size.
Colors: Bullish, bearish, strong signal, weak signal, neutral.
TECHNICAL NOTES
Only 4 request.security() calls using tuple syntax — returns trend, momentum, structure, strength, RSI, and MACD per call
All analysis via f_analyze() function called on each timeframe
barmerge.lookahead_off on all security calls
Signals only on barstate.isconfirmed
Cooldown prevents signal clustering
Structure uses ta.pivothigh/pivotlow with confirmation delay
Dashboard renders on barstate.islast only
DISCLAIMER
This indicator is for educational and informational purposes only. It does not constitute financial advice. Multi-timeframe confluence increases probability but does not guarantee outcomes. Higher timeframe data is subject to the limitations of TradingView's request.security() function. Always use proper risk management. Past performance does not guarantee future results.
Script de código abierto
Fiel al espíritu de TradingView, el creador de este script lo ha convertido en código abierto, para que los traders puedan revisar y verificar su funcionalidad. ¡Enhorabuena al autor! Aunque puede utilizarlo de forma gratuita, recuerde que cualquier republicación del código está sujeta a nuestras Normas internas.

🔵Gain access to our powerful tools : forexobroker.com/tv
🔵Join our free telegram for updates : t.me/dominicwalsfxhtrader
All scripts & content provided by Forexobroker are for informational & educational purposes only.
🔵Join our free telegram for updates : t.me/dominicwalsfxhtrader
All scripts & content provided by Forexobroker are for informational & educational purposes only.
Exención de responsabilidad
La información y las publicaciones no constituyen, ni deben considerarse como, asesoramiento o recomendaciones financieras, de inversión, de trading u otro tipo, proporcionadas o respaldadas por TradingView. Obtenga más información en Condiciones de uso.
Script de código abierto
Fiel al espíritu de TradingView, el creador de este script lo ha convertido en código abierto, para que los traders puedan revisar y verificar su funcionalidad. ¡Enhorabuena al autor! Aunque puede utilizarlo de forma gratuita, recuerde que cualquier republicación del código está sujeta a nuestras Normas internas.
🔵Gain access to our powerful tools : forexobroker.com/tv
🔵Join our free telegram for updates : t.me/dominicwalsfxhtrader
All scripts & content provided by Forexobroker are for informational & educational purposes only.
🔵Join our free telegram for updates : t.me/dominicwalsfxhtrader
All scripts & content provided by Forexobroker are for informational & educational purposes only.
Exención de responsabilidad
La información y las publicaciones no constituyen, ni deben considerarse como, asesoramiento o recomendaciones financieras, de inversión, de trading u otro tipo, proporcionadas o respaldadas por TradingView. Obtenga más información en Condiciones de uso.