OPEN-SOURCE SCRIPT
Actualizado Zen YCT - Liquidity Monitor
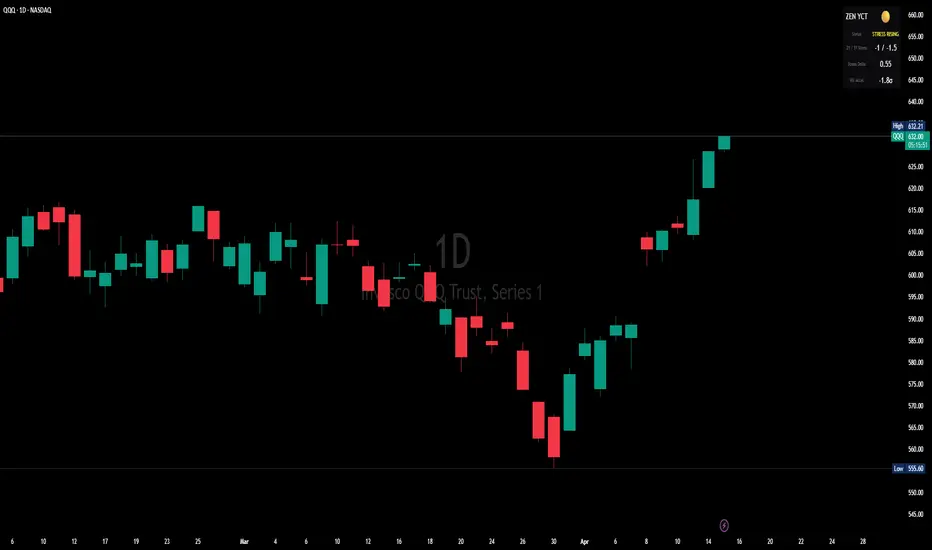
The "Zen YCT - Liquidity Monitor," is a sophisticated macro-overlay designed to track global liquidity stress by monitoring the Yen Carry Trade (YCT) and bond yield differentials. It translates complex intermarket relationships into a simple "Traffic Light" dashboard on your TradingView chart.
Core Concept - The indicator operates on the premise that global liquidity is often driven by the yield spread between US and Japanese government bonds. When these spreads compress rapidly (Z-score drops) or the USD/JPY pair breaks down, it signals a potential unwinding of the carry trade, which historically leads to volatility in equities (like the QQQ).
Key Features & Mechanics
1. Intermarket Data Integration - The script pulls data from several key asset classes to build a "Stress Profile":
-Yield Spreads: Monitors the gap between US and Japanese 2-Year and 5-Year yields.
-Currency Momentum: Tracks the Rate of Change (ROC) for USD/JPY on a 4-hour timeframe.
-Volatility: Monitors VIX acceleration to confirm if market fear is rising alongside liquidity shifts.
2. Statistical "Stress" Logic (Z-Scores)
Rather than looking at raw prices, the script calculates a Daily Z-Score for the spreads and the VIX. This measures how many standard deviations the current value is from its mean over a specific lookback period (default 20 days).
-A negative Z-score in the yield spreads suggests the "carry" is becoming less attractive or a squeeze is occurring.
-A positive Z-score in the VIX indicates an abnormal spike in fear.
3. The "Traffic Light" Status System
🟢 Liquidity Stable - Normal historical range
🟡 Stress Rising - 2y/5Y spreads not favorable
🔴 Liquidity Crunch Spreads
Dashboard Elements
The script renders a clean, customizable table (default: Top Right) displaying:
-Zen YCT Header: Shows the emoji status (🟢/🟡/🔴) for at-a-glance monitoring.
-2Y / 5Y Stress: The real-time Z-scores of the US-Japan bond spreads.
-Stress Delta: The difference between the 2Y and 5Y stress levels.
-VIX Accel: The current sigma move of the VIX (e.g., "2.5σ").
Usage Tip
This is a Macro-Overlay, not a traditional buy/sell signal generator. Use it to determine "Market Regime." If the Zen YCT turns Red, it suggests that even if your technical setup looks good, the underlying plumbing of the market is broken, and the risk of a "Sigma Move" to the downside is significantly elevated.
Core Concept - The indicator operates on the premise that global liquidity is often driven by the yield spread between US and Japanese government bonds. When these spreads compress rapidly (Z-score drops) or the USD/JPY pair breaks down, it signals a potential unwinding of the carry trade, which historically leads to volatility in equities (like the QQQ).
Key Features & Mechanics
1. Intermarket Data Integration - The script pulls data from several key asset classes to build a "Stress Profile":
-Yield Spreads: Monitors the gap between US and Japanese 2-Year and 5-Year yields.
-Currency Momentum: Tracks the Rate of Change (ROC) for USD/JPY on a 4-hour timeframe.
-Volatility: Monitors VIX acceleration to confirm if market fear is rising alongside liquidity shifts.
2. Statistical "Stress" Logic (Z-Scores)
Rather than looking at raw prices, the script calculates a Daily Z-Score for the spreads and the VIX. This measures how many standard deviations the current value is from its mean over a specific lookback period (default 20 days).
-A negative Z-score in the yield spreads suggests the "carry" is becoming less attractive or a squeeze is occurring.
-A positive Z-score in the VIX indicates an abnormal spike in fear.
3. The "Traffic Light" Status System
🟢 Liquidity Stable - Normal historical range
🟡 Stress Rising - 2y/5Y spreads not favorable
🔴 Liquidity Crunch Spreads
Dashboard Elements
The script renders a clean, customizable table (default: Top Right) displaying:
-Zen YCT Header: Shows the emoji status (🟢/🟡/🔴) for at-a-glance monitoring.
-2Y / 5Y Stress: The real-time Z-scores of the US-Japan bond spreads.
-Stress Delta: The difference between the 2Y and 5Y stress levels.
-VIX Accel: The current sigma move of the VIX (e.g., "2.5σ").
Usage Tip
This is a Macro-Overlay, not a traditional buy/sell signal generator. Use it to determine "Market Regime." If the Zen YCT turns Red, it suggests that even if your technical setup looks good, the underlying plumbing of the market is broken, and the risk of a "Sigma Move" to the downside is significantly elevated.
Notas de prensa
The "Zen YCT - Liquidity Monitor," is a macro-overlay designed to track global liquidity stress by monitoring the Yen Carry Trade (YCT) and bond yield differentials. It translates complex intermarket relationships into a simple "Traffic Light" dashboard on your TradingView chart. Core Concept - The indicator operates on the premise that global liquidity is often driven by the yield spread between US and Japanese government bonds. When these spreads compress rapidly (Z-score drops) or the USD/JPY pair breaks down, it signals a potential unwinding of the carry trade, which historically leads to volatility in equities (like the QQQ).
Key Features & Mechanics
1. Intermarket Data Integration - The script pulls data from several key asset classes to build a "Stress Profile":
-Yield Spreads: Monitors the gap between US and Japanese 2-Year and 5-Year yields.
-Currency Momentum: Tracks the Rate of Change (ROC) for USD/JPY on a 4-hour timeframe.
-Volatility: Monitors VIX acceleration to confirm if market fear is rising alongside liquidity shifts.
2. Statistical "Stress" Logic (Z-Scores)
Rather than looking at raw prices, the script calculates a Daily Z-Score for the spreads and the VIX. This measures how many standard deviations the current value is from its mean over a specific lookback period (default 20 days).
-A negative Z-score in the yield spreads suggests the "carry" is becoming less attractive or a squeeze is occurring.
-A positive Z-score in the VIX indicates an abnormal spike in fear.
3. The "Traffic Light" Status System
🟢 Liquidity Stable - Normal historical range
🟡 Stress Rising - 2y/5Y spreads not favorable
🔴 Liquidity Crunch Spreads
Dashboard Elements
The script renders a clean, customizable table (default: Top Right) displaying:
-Zen YCT Header: Shows the emoji status (🟢/🟡/🔴) for at-a-glance monitoring.
-2Y / 5Y Stress: The real-time Z-scores of the US-Japan bond spreads.
-Stress Delta: The difference between the 2Y and 5Y stress levels.
-VIX Accel: The current sigma move of the VIX (e.g., "2.5σ").
Usage Tip
This is a Macro-Overlay, not a traditional buy/sell signal generator. Use it to determine "Market Regime." If the Zen YCT turns Red, it suggests that even if your technical setup looks good, the underlying plumbing of the market is broken, and the risk of a "Sigma Move" to the downside is significantly elevated.
Script de código abierto
Fiel al espíritu de TradingView, el creador de este script lo ha convertido en código abierto, para que los traders puedan revisar y verificar su funcionalidad. ¡Enhorabuena al autor! Aunque puede utilizarlo de forma gratuita, recuerde que cualquier republicación del código está sujeta a nuestras Normas internas.

Exención de responsabilidad
La información y las publicaciones no constituyen, ni deben considerarse como, asesoramiento o recomendaciones financieras, de inversión, de trading u otro tipo, proporcionadas o respaldadas por TradingView. Obtenga más información en Condiciones de uso.
Script de código abierto
Fiel al espíritu de TradingView, el creador de este script lo ha convertido en código abierto, para que los traders puedan revisar y verificar su funcionalidad. ¡Enhorabuena al autor! Aunque puede utilizarlo de forma gratuita, recuerde que cualquier republicación del código está sujeta a nuestras Normas internas.
Exención de responsabilidad
La información y las publicaciones no constituyen, ni deben considerarse como, asesoramiento o recomendaciones financieras, de inversión, de trading u otro tipo, proporcionadas o respaldadas por TradingView. Obtenga más información en Condiciones de uso.