POC Backtest + Cycle Top Exit [v6]
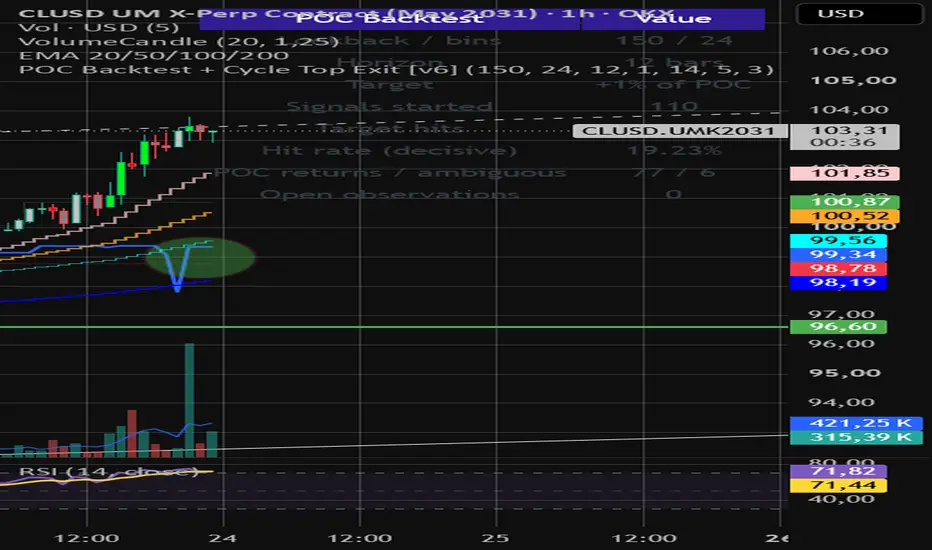
# POC Backtest + Cycle Reversal Exit Indicator (Pine Script v6)
## Overview
This indicator combines a **Point of Control (POC) distance backtest** with **cycle reversal signals**. It is designed to identify potential market cycle tops and bottoms and to test whether price tends to move further away from the POC after crossing it.
## 1. Rolling Point of Control (POC)
- Calculates a rolling POC using a configurable lookback period.
- Divides the recent price range into configurable price bins.
- Assigns each candle's volume to the bin containing its HLC3 price (the average of the high, low, and close).
- Displays the calculated POC as a blue line.
**Important:** This is an approximation of a Volume Profile POC, not a full exchange-level volume profile.
## 2. POC Entry Signals
- **Green triangle pointing up:** Price crosses above the POC, generating a potential long signal.
- **Orange triangle pointing down:** Price crosses below the POC, generating a potential bearish signal.
Signals are generated only after the candle closes.
## 3. POC Distance Backtest
The backtest evaluates whether price moves farther away from the POC after a bullish POC crossover.
### Entry conditions
- A candle closes above the POC.
- The previous candle closed at or below its POC.
### Target
The target is calculated as:
Target = Entry Close + (POC × Target Percentage)
The default target percentage is 1%.
### Evaluation period
The default evaluation period is 12 completed candles. On a 4-hour chart, this corresponds to 48 hours.
### Outcomes
- **Target hit:** Price reaches the target within the evaluation period.
- **POC return:** Price returns to the entry POC before the target is reached.
- **Miss:** Neither the target nor the POC return occurs within the evaluation period.
- **Ambiguous:** Both the target and the entry POC are touched within the same candle, so the intrabar sequence cannot be determined from candle data alone.
The statistics table displays the number of signals, target hits, hit rate, POC returns, ambiguous outcomes, and open observations.
## 4. Cycle Reversal Signals
The indicator uses RSI divergence and price structure to identify potential cycle reversals.
### Bearish cycle top
A red downward triangle labelled **EXIT** appears when:
1. Price forms a higher high.
2. RSI forms a lower high, indicating bearish divergence.
3. Price subsequently closes below the last confirmed swing low.
4. RSI is weakening.
This combination suggests that bullish momentum may be fading and a downward reversal may be developing.
### Bullish cycle bottom
A red upward triangle labelled **EXIT** appears when:
1. Price forms a lower low.
2. RSI forms a higher low, indicating bullish divergence.
3. Price subsequently closes above the last confirmed swing high.
4. RSI is strengthening.
This combination suggests that bearish momentum may be fading and an upward reversal may be developing.
### Warning signals
- **Orange circle:** Potential bearish divergence.
- **Light-blue circle:** Potential bullish divergence.
The warning circles indicate a possible reversal setup. The red EXIT triangles require an additional price-structure confirmation.
## 5. Supported Timeframes
The indicator can be used on:
- 1-hour charts
- 4-hour charts
- Daily charts
The pivot settings can be adjusted to make the indicator more or less sensitive to market swings.
## 6. Alerts
TradingView alerts are available for:
- Confirmed bearish cycle top exits
- Confirmed bullish cycle bottom exits
## Important Limitations
- The POC calculation is an approximation based on HLC3 and candle volume.
- Pivot-based signals require confirmation bars, so signals inevitably appear after the actual high or low.
- RSI divergence does not guarantee a reversal.
- The POC backtest evaluates bullish POC-cross signals only; it does not measure the profitability of the cycle EXIT signals.
- The backtest does not account for fees, slippage, or position sizing.
- The indicator is a decision-support tool, not an automated trading strategy or a guarantee of future price movements.
## Overview
This indicator combines a **Point of Control (POC) distance backtest** with **cycle reversal signals**. It is designed to identify potential market cycle tops and bottoms and to test whether price tends to move further away from the POC after crossing it.
## 1. Rolling Point of Control (POC)
- Calculates a rolling POC using a configurable lookback period.
- Divides the recent price range into configurable price bins.
- Assigns each candle's volume to the bin containing its HLC3 price (the average of the high, low, and close).
- Displays the calculated POC as a blue line.
**Important:** This is an approximation of a Volume Profile POC, not a full exchange-level volume profile.
## 2. POC Entry Signals
- **Green triangle pointing up:** Price crosses above the POC, generating a potential long signal.
- **Orange triangle pointing down:** Price crosses below the POC, generating a potential bearish signal.
Signals are generated only after the candle closes.
## 3. POC Distance Backtest
The backtest evaluates whether price moves farther away from the POC after a bullish POC crossover.
### Entry conditions
- A candle closes above the POC.
- The previous candle closed at or below its POC.
### Target
The target is calculated as:
Target = Entry Close + (POC × Target Percentage)
The default target percentage is 1%.
### Evaluation period
The default evaluation period is 12 completed candles. On a 4-hour chart, this corresponds to 48 hours.
### Outcomes
- **Target hit:** Price reaches the target within the evaluation period.
- **POC return:** Price returns to the entry POC before the target is reached.
- **Miss:** Neither the target nor the POC return occurs within the evaluation period.
- **Ambiguous:** Both the target and the entry POC are touched within the same candle, so the intrabar sequence cannot be determined from candle data alone.
The statistics table displays the number of signals, target hits, hit rate, POC returns, ambiguous outcomes, and open observations.
## 4. Cycle Reversal Signals
The indicator uses RSI divergence and price structure to identify potential cycle reversals.
### Bearish cycle top
A red downward triangle labelled **EXIT** appears when:
1. Price forms a higher high.
2. RSI forms a lower high, indicating bearish divergence.
3. Price subsequently closes below the last confirmed swing low.
4. RSI is weakening.
This combination suggests that bullish momentum may be fading and a downward reversal may be developing.
### Bullish cycle bottom
A red upward triangle labelled **EXIT** appears when:
1. Price forms a lower low.
2. RSI forms a higher low, indicating bullish divergence.
3. Price subsequently closes above the last confirmed swing high.
4. RSI is strengthening.
This combination suggests that bearish momentum may be fading and an upward reversal may be developing.
### Warning signals
- **Orange circle:** Potential bearish divergence.
- **Light-blue circle:** Potential bullish divergence.
The warning circles indicate a possible reversal setup. The red EXIT triangles require an additional price-structure confirmation.
## 5. Supported Timeframes
The indicator can be used on:
- 1-hour charts
- 4-hour charts
- Daily charts
The pivot settings can be adjusted to make the indicator more or less sensitive to market swings.
## 6. Alerts
TradingView alerts are available for:
- Confirmed bearish cycle top exits
- Confirmed bullish cycle bottom exits
## Important Limitations
- The POC calculation is an approximation based on HLC3 and candle volume.
- Pivot-based signals require confirmation bars, so signals inevitably appear after the actual high or low.
- RSI divergence does not guarantee a reversal.
- The POC backtest evaluates bullish POC-cross signals only; it does not measure the profitability of the cycle EXIT signals.
- The backtest does not account for fees, slippage, or position sizing.
- The indicator is a decision-support tool, not an automated trading strategy or a guarantee of future price movements.

Exención de responsabilidad
La información y las publicaciones no constituyen, ni deben considerarse como, asesoramiento o recomendaciones financieras, de inversión, de trading u otro tipo, proporcionadas o respaldadas por TradingView. Obtenga más información en Condiciones de uso.
Exención de responsabilidad
La información y las publicaciones no constituyen, ni deben considerarse como, asesoramiento o recomendaciones financieras, de inversión, de trading u otro tipo, proporcionadas o respaldadas por TradingView. Obtenga más información en Condiciones de uso.