Omega Strategy Excursion
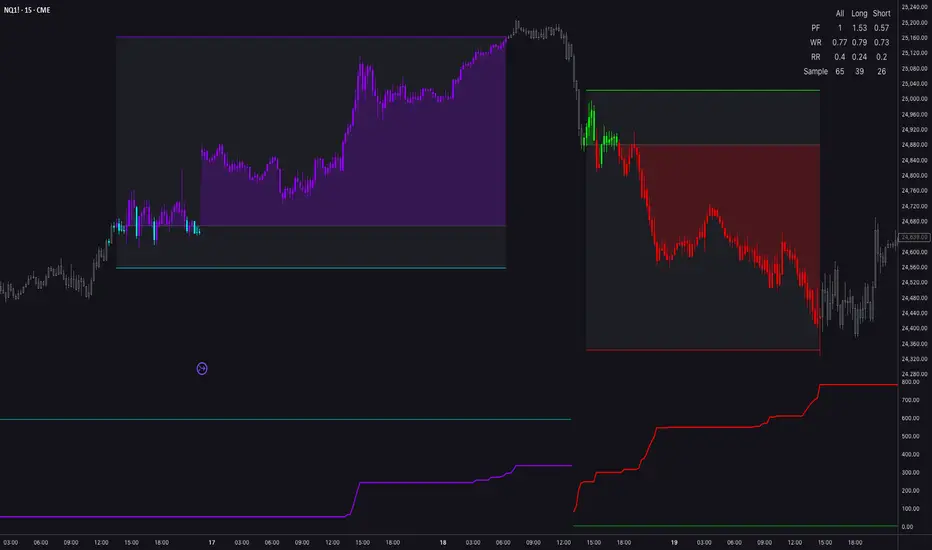
Omega Strategy Excursion Tester is a research and validation tool designed to help traders test, structure, and refine discretionary or systematic trade ideas directly on the chart. It is not a black-box strategy, and it is not intended to provide ready-made investment decisions. Its purpose is to assist the trader in transforming a market hypothesis into a measurable execution framework by combining signal logic, directional filtering, contextual location analysis, trade projection levels, and maximum excursion statistics.
At its core, this tool is built to answer one of the most important questions in strategy development: once a valid entry idea is defined, how far do trades usually move against the position before working, and how far do they typically extend in favor of the trade before exhausting? In other words, it is specifically designed to study MAE and MFE behavior in a practical chart-based environment. This allows traders to move away from arbitrary stop-loss and take-profit placement and instead anchor risk and reward levels to the empirical behavior of their own setup.
The script generates long and short trade hypotheses from a modular structure made of three separate analytical layers. The first layer is the trigger, which defines the event that initiates a possible opportunity. The second layer is the filter, which acts as directional confirmation or broader bias selection. The third layer is the location component, which identifies whether price is currently in a statistically or technically favorable area for the chosen direction. These three layers can be combined in different ways, allowing the user to test whether a setup performs better when based only on a trigger, when aligned with broader directional context, or when restricted to specific overextended or compressed price locations.
The trigger engine offers several distinct entry archetypes. Z-Score mode detects statistically stretched conditions relative to a moving average and standard deviation framework. Engulfing mode looks for directional engulfing patterns with a volume condition. Breakout mode detects range expansion beyond recent highs or lows while controlling for momentum saturation with RSI. Manipulation mode searches for stop-run or sweep-style behavior, where price briefly exceeds recent extremes and then closes back with directional intent. These trigger styles are intentionally different from one another, so the tool can be used across mean reversion, continuation, breakout, and manipulation-based trading ideas.
The filter layer provides directional bias. The RVWAP option uses a fast-versus-slow rolling VWAP relationship to maintain a directional state, while the MS option uses a market structure style midline progression to define bullish or bearish conditions. This is useful when the trader wants entries to be taken only in the direction of a broader trend or structural bias. Because the filter can be requested from a separate timeframe, the script can also be used in multi-timeframe workflows, such as lower-timeframe execution aligned with a higher-timeframe directional regime.
The location layer adds contextual selectivity. This component is meant to restrict signals to areas where the underlying setup statistically or technically makes more sense. The StDev option evaluates whether the price is outside Bollinger-based deviation bands, the %R option checks whether the price is in an extreme portion of its recent range, and the RSI option evaluates momentum exhaustion zones. By separating direction from location, the script lets the user study a very important aspect of strategy research: not every signal is equal, and the same trigger may behave very differently depending on where it occurs.
Once the chosen signal framework produces a valid event, the script records a reference entry and begins monitoring the trade behavior. At that point, it continuously measures both adverse excursion and favorable excursion. For long trades, MAE is tracked as the distance between the entry and the lowest price reached during the life of the trade, while MFE is tracked as the distance between the entry and the highest price reached. For short trades, the logic is mirrored accordingly. This creates a running profile of how each trade evolves after the signal occurs.
These observations are then stored in historical distributions. Rather than using fixed stop-loss and take-profit distances, the tool derives projected levels from the percentile structure of those distributions. This is one of its most valuable features. The user can select the MAE percentile used for stop-loss generation and the MFE percentile used for target generation. This makes the output adaptable to different philosophies. A more conservative trader may choose lower MFE expectations and tighter MAE thresholds, while a more patient trader may prefer broader adverse tolerance and larger projected reward.
The Double Levels mode extends this concept further. Instead of showing only one stop and one target, the script splits the historical distribution into lower and higher excursion groups around their average and generates two projected levels for each side. In practice, this creates a more nuanced execution map. The first level can be interpreted as a more conservative or more frequently reached projection, while the second level can be seen as a more demanding or wider statistical extension. This feature is particularly useful when testing partial profit-taking logic, staggered exits, tiered stop structures, or different execution styles under the same signal framework.
The resulting chart overlay provides a visual trade framework around every validated signal. Entry, stop, and target levels are displayed directly on the chart, with optional line rendering and optional filled zones. The visual engine is designed not only for aesthetics but for interpretation. It helps the user see whether a current or historical trade was progressing inside a statistically normal range, approaching adverse extremes, or moving toward its favorable extension. Candle coloring can also reflect the evolving profit and loss condition of the active signal, allowing the trader to visually read the current state of the setup in relation to the projected levels.
An additional important setting is the Fixed mode. When enabled, the script avoids repeatedly refreshing the active signal state in the same direction until conditions reset. This is useful when the trader wants a stable level of generation around a discrete event instead of continuous recalculation. The Close at trend change option adds another layer of realism for research purposes by allowing the script to terminate the active study when the directional state reverses. This helps simulate the behavior of traders who would not hold a position through a complete directional inversion and want the historical distributions to reflect earlier logical exits rather than only hard stop or hard target completion.
The lower pane is where the statistical study becomes especially informative. The tool plots the live MAE and MFE paths for long and short trades as they develop, as well as average excursion references. This allows the user to observe whether a current setup is behaving within a normal historical range or whether it is already deviating from the typical pattern of previous trades. In practical use, this can help answer questions such as whether the current trade is still statistically healthy, whether the stop is too tight relative to historical noise, or whether the reward expectation is unrealistic for that specific type of entry.
A built-in summary table provides compact performance diagnostics for all trades, long-only trades, and short-only trades. These include profit factor, win rate, reward-to-risk ratio, and sample size. These metrics are not meant to replace a dedicated strategy backtest engine, but they are highly useful for quick comparative research. They allow the user to compare variations of the same idea, such as one trigger versus another, one filter timeframe versus another, or one location condition versus another, without needing to build a full automated strategy every time. This makes the script especially effective during the concept validation phase of strategy development.
In real use, the best way to approach Omega Signals Target Generator is not to ask whether it “works” in isolation, but whether it helps you understand the structure of your own trading logic. A strong workflow would usually be the following. First, define the type of behavior you want to study: mean reversion, breakout, manipulation, momentum continuation, or another repeatable pattern. Second, select the trigger that most closely represents that behavior. Third, apply a directional filter if your idea performs better when aligned with a higher-timeframe or structural bias. Fourth, add a location condition if you want signals only when price is stretched, compressed, overbought, oversold, or statistically displaced. Fifth, let the script build historical MAE and MFE distributions. Finally, study the projected levels and summary metrics to determine whether your stop and target logic is realistic, whether long and short behavior are symmetric, and whether the setup improves or degrades under different contextual conditions.
This tool is particularly valuable for traders who already have a conceptual edge but need help quantifying it. It can be used by discretionary traders who want to validate chart-reading ideas, by system developers who want a faster prototyping layer before writing a full strategy, and by performance-oriented traders who want to replace intuition-based exits with evidence-based trade management. It is also useful for comparing the quality of market regimes, timeframes, and directional states. Because the tool studies excursion behavior directly, it is well suited for designing stop-loss models, target models, scaling logic, partial exits, and asymmetric reward frameworks.
It is important to understand what this script is and what it is not. It is an analytical engine for structured signal research. It does not claim to produce optimal entries in all markets, and it does not eliminate the need for trader judgment, market understanding, or external validation. The outputs are derived from historical chart behavior under the selected configuration. As with any historical model, results are sensitive to sample quality, market regime, timeframe selection, instrument characteristics, liquidity conditions, and parameter choice. A strong-looking profile on one instrument or one period does not guarantee equivalent behavior elsewhere.
Users should also be aware that any MAE and MFE study is only as useful as the logic used to define trade start and trade end. This script provides a robust framework for that analysis, but the quality of the conclusions depends on whether the chosen trigger, filter, location, session, and exit assumptions truly represent the strategy being studied. For this reason, the tool should be treated as a decision-support and research instrument, not as a substitute for complete testing, execution modeling, or professional risk management.
Disclaimer: This script is provided for research, educational, and analytical purposes only. It does not constitute financial advice, investment advice, trading advice, or a solicitation to buy or sell any financial instrument. It is not a fully automated trading strategy and should not be interpreted as a promise of profitability or future performance. All outputs, including signals, projected stop-loss and take-profit levels, MAE and MFE statistics, and summary metrics, are based on historical price behavior and user-selected settings. Past behavior does not guarantee future results. Market conditions change, statistical distributions evolve, and real-world execution may differ materially due to slippage, spreads, latency, liquidity, volatility, and trader discretion. Users are solely responsible for their own decisions, testing process, and risk management. Always validate any idea independently before applying it in live markets.
At its core, this tool is built to answer one of the most important questions in strategy development: once a valid entry idea is defined, how far do trades usually move against the position before working, and how far do they typically extend in favor of the trade before exhausting? In other words, it is specifically designed to study MAE and MFE behavior in a practical chart-based environment. This allows traders to move away from arbitrary stop-loss and take-profit placement and instead anchor risk and reward levels to the empirical behavior of their own setup.
The script generates long and short trade hypotheses from a modular structure made of three separate analytical layers. The first layer is the trigger, which defines the event that initiates a possible opportunity. The second layer is the filter, which acts as directional confirmation or broader bias selection. The third layer is the location component, which identifies whether price is currently in a statistically or technically favorable area for the chosen direction. These three layers can be combined in different ways, allowing the user to test whether a setup performs better when based only on a trigger, when aligned with broader directional context, or when restricted to specific overextended or compressed price locations.
The trigger engine offers several distinct entry archetypes. Z-Score mode detects statistically stretched conditions relative to a moving average and standard deviation framework. Engulfing mode looks for directional engulfing patterns with a volume condition. Breakout mode detects range expansion beyond recent highs or lows while controlling for momentum saturation with RSI. Manipulation mode searches for stop-run or sweep-style behavior, where price briefly exceeds recent extremes and then closes back with directional intent. These trigger styles are intentionally different from one another, so the tool can be used across mean reversion, continuation, breakout, and manipulation-based trading ideas.
The filter layer provides directional bias. The RVWAP option uses a fast-versus-slow rolling VWAP relationship to maintain a directional state, while the MS option uses a market structure style midline progression to define bullish or bearish conditions. This is useful when the trader wants entries to be taken only in the direction of a broader trend or structural bias. Because the filter can be requested from a separate timeframe, the script can also be used in multi-timeframe workflows, such as lower-timeframe execution aligned with a higher-timeframe directional regime.
The location layer adds contextual selectivity. This component is meant to restrict signals to areas where the underlying setup statistically or technically makes more sense. The StDev option evaluates whether the price is outside Bollinger-based deviation bands, the %R option checks whether the price is in an extreme portion of its recent range, and the RSI option evaluates momentum exhaustion zones. By separating direction from location, the script lets the user study a very important aspect of strategy research: not every signal is equal, and the same trigger may behave very differently depending on where it occurs.
Once the chosen signal framework produces a valid event, the script records a reference entry and begins monitoring the trade behavior. At that point, it continuously measures both adverse excursion and favorable excursion. For long trades, MAE is tracked as the distance between the entry and the lowest price reached during the life of the trade, while MFE is tracked as the distance between the entry and the highest price reached. For short trades, the logic is mirrored accordingly. This creates a running profile of how each trade evolves after the signal occurs.
These observations are then stored in historical distributions. Rather than using fixed stop-loss and take-profit distances, the tool derives projected levels from the percentile structure of those distributions. This is one of its most valuable features. The user can select the MAE percentile used for stop-loss generation and the MFE percentile used for target generation. This makes the output adaptable to different philosophies. A more conservative trader may choose lower MFE expectations and tighter MAE thresholds, while a more patient trader may prefer broader adverse tolerance and larger projected reward.
The Double Levels mode extends this concept further. Instead of showing only one stop and one target, the script splits the historical distribution into lower and higher excursion groups around their average and generates two projected levels for each side. In practice, this creates a more nuanced execution map. The first level can be interpreted as a more conservative or more frequently reached projection, while the second level can be seen as a more demanding or wider statistical extension. This feature is particularly useful when testing partial profit-taking logic, staggered exits, tiered stop structures, or different execution styles under the same signal framework.
The resulting chart overlay provides a visual trade framework around every validated signal. Entry, stop, and target levels are displayed directly on the chart, with optional line rendering and optional filled zones. The visual engine is designed not only for aesthetics but for interpretation. It helps the user see whether a current or historical trade was progressing inside a statistically normal range, approaching adverse extremes, or moving toward its favorable extension. Candle coloring can also reflect the evolving profit and loss condition of the active signal, allowing the trader to visually read the current state of the setup in relation to the projected levels.
An additional important setting is the Fixed mode. When enabled, the script avoids repeatedly refreshing the active signal state in the same direction until conditions reset. This is useful when the trader wants a stable level of generation around a discrete event instead of continuous recalculation. The Close at trend change option adds another layer of realism for research purposes by allowing the script to terminate the active study when the directional state reverses. This helps simulate the behavior of traders who would not hold a position through a complete directional inversion and want the historical distributions to reflect earlier logical exits rather than only hard stop or hard target completion.
The lower pane is where the statistical study becomes especially informative. The tool plots the live MAE and MFE paths for long and short trades as they develop, as well as average excursion references. This allows the user to observe whether a current setup is behaving within a normal historical range or whether it is already deviating from the typical pattern of previous trades. In practical use, this can help answer questions such as whether the current trade is still statistically healthy, whether the stop is too tight relative to historical noise, or whether the reward expectation is unrealistic for that specific type of entry.
A built-in summary table provides compact performance diagnostics for all trades, long-only trades, and short-only trades. These include profit factor, win rate, reward-to-risk ratio, and sample size. These metrics are not meant to replace a dedicated strategy backtest engine, but they are highly useful for quick comparative research. They allow the user to compare variations of the same idea, such as one trigger versus another, one filter timeframe versus another, or one location condition versus another, without needing to build a full automated strategy every time. This makes the script especially effective during the concept validation phase of strategy development.
In real use, the best way to approach Omega Signals Target Generator is not to ask whether it “works” in isolation, but whether it helps you understand the structure of your own trading logic. A strong workflow would usually be the following. First, define the type of behavior you want to study: mean reversion, breakout, manipulation, momentum continuation, or another repeatable pattern. Second, select the trigger that most closely represents that behavior. Third, apply a directional filter if your idea performs better when aligned with a higher-timeframe or structural bias. Fourth, add a location condition if you want signals only when price is stretched, compressed, overbought, oversold, or statistically displaced. Fifth, let the script build historical MAE and MFE distributions. Finally, study the projected levels and summary metrics to determine whether your stop and target logic is realistic, whether long and short behavior are symmetric, and whether the setup improves or degrades under different contextual conditions.
This tool is particularly valuable for traders who already have a conceptual edge but need help quantifying it. It can be used by discretionary traders who want to validate chart-reading ideas, by system developers who want a faster prototyping layer before writing a full strategy, and by performance-oriented traders who want to replace intuition-based exits with evidence-based trade management. It is also useful for comparing the quality of market regimes, timeframes, and directional states. Because the tool studies excursion behavior directly, it is well suited for designing stop-loss models, target models, scaling logic, partial exits, and asymmetric reward frameworks.
It is important to understand what this script is and what it is not. It is an analytical engine for structured signal research. It does not claim to produce optimal entries in all markets, and it does not eliminate the need for trader judgment, market understanding, or external validation. The outputs are derived from historical chart behavior under the selected configuration. As with any historical model, results are sensitive to sample quality, market regime, timeframe selection, instrument characteristics, liquidity conditions, and parameter choice. A strong-looking profile on one instrument or one period does not guarantee equivalent behavior elsewhere.
Users should also be aware that any MAE and MFE study is only as useful as the logic used to define trade start and trade end. This script provides a robust framework for that analysis, but the quality of the conclusions depends on whether the chosen trigger, filter, location, session, and exit assumptions truly represent the strategy being studied. For this reason, the tool should be treated as a decision-support and research instrument, not as a substitute for complete testing, execution modeling, or professional risk management.
Disclaimer: This script is provided for research, educational, and analytical purposes only. It does not constitute financial advice, investment advice, trading advice, or a solicitation to buy or sell any financial instrument. It is not a fully automated trading strategy and should not be interpreted as a promise of profitability or future performance. All outputs, including signals, projected stop-loss and take-profit levels, MAE and MFE statistics, and summary metrics, are based on historical price behavior and user-selected settings. Past behavior does not guarantee future results. Market conditions change, statistical distributions evolve, and real-world execution may differ materially due to slippage, spreads, latency, liquidity, volatility, and trader discretion. Users are solely responsible for their own decisions, testing process, and risk management. Always validate any idea independently before applying it in live markets.
Disponible en el Espacio de pago
Este indicador solo está disponible para suscriptores de Quant Suite. Suscríbase para acceder a este y otros scripts de OmegaTools.

Exención de responsabilidad
La información y las publicaciones no constituyen, ni deben considerarse como, asesoramiento o recomendaciones financieras, de inversión, de trading u otro tipo, proporcionadas o respaldadas por TradingView. Obtenga más información en Condiciones de uso.
Disponible en el Espacio de pago
Este indicador solo está disponible para suscriptores de Quant Suite. Suscríbase para acceder a este y otros scripts de OmegaTools.
Exención de responsabilidad
La información y las publicaciones no constituyen, ni deben considerarse como, asesoramiento o recomendaciones financieras, de inversión, de trading u otro tipo, proporcionadas o respaldadas por TradingView. Obtenga más información en Condiciones de uso.