OPEN-SOURCE SCRIPT
Absorption Reversal
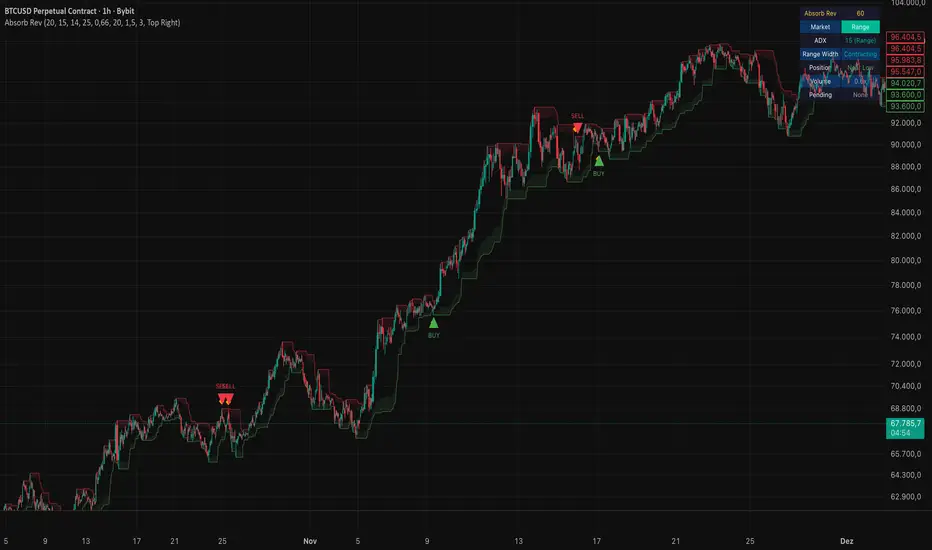
Absorption Reversal detects institutional absorption patterns at the extremes of a trading range. When price reaches a range boundary, large limit orders from institutional players can "absorb" aggressive market orders — this creates a characteristic candle with high volume and a long rejection wick. The indicator identifies these setups and waits for confirmation before signaling a reversal.
Free & Open Source — no invite-only access, no paywall. Full source code, fully transparent.
## The Concept: What Is Absorption?
In order flow terms, absorption occurs when resting limit orders at a price level absorb incoming market orders without allowing price to break through. This is a core concept in Wyckoff analysis (Effort vs. Result) and institutional trading:
- High volume (Effort) + small price movement / long wick (no Result) = absorption
- The wick shows that price was pushed to the extreme but immediately rejected
- This typically happens at range boundaries where institutional players defend levels
The indicator automates this detection process with quantifiable rules.
## How It Works
The signal generation follows a strict 6-step process:
Step 1 — Range Detection: A Donchian Channel (highest high / lowest low) defines the current trading range boundaries.
Step 2 — Range Width Filter: The channel width must be below its own average — confirming the market is sideways/contracting, not expanding into a trend.
Step 3 — ADX Trend Filter: Wilder's ADX must be below the threshold (default 25) — no strong trend active. Absorption setups work best in range-bound markets.
Step 4 — Proximity Check: Price must be in the upper or lower proximity zone of the range (default: outer 15%). Absorption in the middle of a range is meaningless.
Step 5 — Absorption Bar: A candle that shows:
- Volume spike (default 1.5x average — significant participation)
- Long rejection wick (default 66% of candle range — strong rejection)
- Located at the range extreme (within proximity zone)
Step 6 — Confirmation: Within the next N bars (default 3), a follow-up candle must close back inside the range in the expected reversal direction. No confirmation = no signal.
## Chart Elements
- Range Lines — Donchian Channel upper (red) and lower (green) boundaries
- Proximity Zones — Optional shaded areas showing where absorption signals can trigger
- Orange Diamonds — Absorption bars detected (before confirmation)
- Green/Red Triangles + BUY/SELL Labels — Confirmed reversal signals only
## Dashboard
The real-time dashboard displays:
- Market Regime — Range or Trending (based on ADX + channel width)
- ADX Value — Current trend strength with classification
- Range Width — Contracting or Expanding
- Position — Where price sits in the range (Near High / Near Low / Middle)
- Volume — Current volume relative to average + spike detection
- Pending — Active absorption bars awaiting confirmation (with countdown)
## Settings
Range Detection: Donchian Channel Length (default 20), Proximity Zone % (default 15%)
Trend Filter: ADX Filter ON/OFF (default ON), Range Width Filter ON/OFF (default ON)
Absorption Criteria: Min Wick/Range Ratio (default 0.66), Volume SMA Length (default 20), Volume Spike Multiplier (default 1.5x)
Confirmation: Max Confirmation Bars (default 3)
## Alerts
4 alert conditions:
- Absorption Buy Signal — confirmed bullish reversal at range low
- Absorption Sell Signal — confirmed bearish reversal at range high
- Bullish Absorption Detected — absorption bar found, awaiting confirmation
- Bearish Absorption Detected — absorption bar found, awaiting confirmation
## Best Used For
- Identifying high-probability reversal setups at range boundaries
- Spotting institutional absorption activity via volume + wick analysis
- Range-trading strategies with clear entry signals
- Confluence tool alongside other indicators
- Works on all instruments: stocks, forex, crypto, futures, indices
## Technical Notes
- Pine Script v6 (latest version)
- Signals on confirmed bars only — no repainting
- State-based confirmation logic
- Open source, no external dependencies
- All inputs have tooltips
## Disclaimer
This indicator is for educational and informational purposes only. It does not constitute financial advice. No signals should be interpreted as buy or sell recommendations. Past performance is not indicative of future results. Always implement proper risk management. Trade at your own risk.
Free & Open Source — no invite-only access, no paywall. Full source code, fully transparent.
## The Concept: What Is Absorption?
In order flow terms, absorption occurs when resting limit orders at a price level absorb incoming market orders without allowing price to break through. This is a core concept in Wyckoff analysis (Effort vs. Result) and institutional trading:
- High volume (Effort) + small price movement / long wick (no Result) = absorption
- The wick shows that price was pushed to the extreme but immediately rejected
- This typically happens at range boundaries where institutional players defend levels
The indicator automates this detection process with quantifiable rules.
## How It Works
The signal generation follows a strict 6-step process:
Step 1 — Range Detection: A Donchian Channel (highest high / lowest low) defines the current trading range boundaries.
Step 2 — Range Width Filter: The channel width must be below its own average — confirming the market is sideways/contracting, not expanding into a trend.
Step 3 — ADX Trend Filter: Wilder's ADX must be below the threshold (default 25) — no strong trend active. Absorption setups work best in range-bound markets.
Step 4 — Proximity Check: Price must be in the upper or lower proximity zone of the range (default: outer 15%). Absorption in the middle of a range is meaningless.
Step 5 — Absorption Bar: A candle that shows:
- Volume spike (default 1.5x average — significant participation)
- Long rejection wick (default 66% of candle range — strong rejection)
- Located at the range extreme (within proximity zone)
Step 6 — Confirmation: Within the next N bars (default 3), a follow-up candle must close back inside the range in the expected reversal direction. No confirmation = no signal.
## Chart Elements
- Range Lines — Donchian Channel upper (red) and lower (green) boundaries
- Proximity Zones — Optional shaded areas showing where absorption signals can trigger
- Orange Diamonds — Absorption bars detected (before confirmation)
- Green/Red Triangles + BUY/SELL Labels — Confirmed reversal signals only
## Dashboard
The real-time dashboard displays:
- Market Regime — Range or Trending (based on ADX + channel width)
- ADX Value — Current trend strength with classification
- Range Width — Contracting or Expanding
- Position — Where price sits in the range (Near High / Near Low / Middle)
- Volume — Current volume relative to average + spike detection
- Pending — Active absorption bars awaiting confirmation (with countdown)
## Settings
Range Detection: Donchian Channel Length (default 20), Proximity Zone % (default 15%)
Trend Filter: ADX Filter ON/OFF (default ON), Range Width Filter ON/OFF (default ON)
Absorption Criteria: Min Wick/Range Ratio (default 0.66), Volume SMA Length (default 20), Volume Spike Multiplier (default 1.5x)
Confirmation: Max Confirmation Bars (default 3)
## Alerts
4 alert conditions:
- Absorption Buy Signal — confirmed bullish reversal at range low
- Absorption Sell Signal — confirmed bearish reversal at range high
- Bullish Absorption Detected — absorption bar found, awaiting confirmation
- Bearish Absorption Detected — absorption bar found, awaiting confirmation
## Best Used For
- Identifying high-probability reversal setups at range boundaries
- Spotting institutional absorption activity via volume + wick analysis
- Range-trading strategies with clear entry signals
- Confluence tool alongside other indicators
- Works on all instruments: stocks, forex, crypto, futures, indices
## Technical Notes
- Pine Script v6 (latest version)
- Signals on confirmed bars only — no repainting
- State-based confirmation logic
- Open source, no external dependencies
- All inputs have tooltips
## Disclaimer
This indicator is for educational and informational purposes only. It does not constitute financial advice. No signals should be interpreted as buy or sell recommendations. Past performance is not indicative of future results. Always implement proper risk management. Trade at your own risk.
Script de código abierto
Fiel al espíritu de TradingView, el creador de este script lo ha convertido en código abierto, para que los traders puedan revisar y verificar su funcionalidad. ¡Enhorabuena al autor! Aunque puede utilizarlo de forma gratuita, recuerde que cualquier republicación del código está sujeta a nuestras Normas internas.

👆More free indicators on my profile.
The complete PRO Suite — every indicator and strategy — in one subscription.
👉 alphachart.trade
The complete PRO Suite — every indicator and strategy — in one subscription.
👉 alphachart.trade
Exención de responsabilidad
La información y las publicaciones no constituyen, ni deben considerarse como, asesoramiento o recomendaciones financieras, de inversión, de trading u otro tipo, proporcionadas o respaldadas por TradingView. Obtenga más información en Condiciones de uso.
Script de código abierto
Fiel al espíritu de TradingView, el creador de este script lo ha convertido en código abierto, para que los traders puedan revisar y verificar su funcionalidad. ¡Enhorabuena al autor! Aunque puede utilizarlo de forma gratuita, recuerde que cualquier republicación del código está sujeta a nuestras Normas internas.
👆More free indicators on my profile.
The complete PRO Suite — every indicator and strategy — in one subscription.
👉 alphachart.trade
The complete PRO Suite — every indicator and strategy — in one subscription.
👉 alphachart.trade
Exención de responsabilidad
La información y las publicaciones no constituyen, ni deben considerarse como, asesoramiento o recomendaciones financieras, de inversión, de trading u otro tipo, proporcionadas o respaldadas por TradingView. Obtenga más información en Condiciones de uso.