ATR Stops vs a Random Walk: How Often Noise Hits Them
WHAT IT DOES
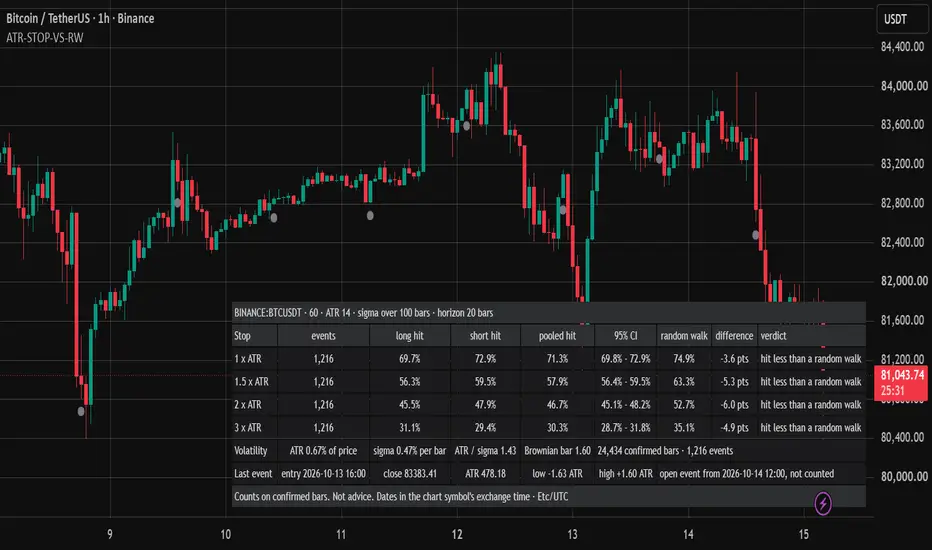
A stop placed a few ATRs from price is meant to sit outside the noise. This indicator counts how often price reaches it anyway, and compares that count with what a pure random walk of the same volatility would give. At regular entries that never overlap, it places a long stop and a short stop at 1, 1.5, 2 and 3 ATRs (defaults) from the close and checks the next N bars: the lows for the long stop, the highs for the short stop. For each multiple the table on the last bar shows the long, short and pooled hit rates with a 95% confidence interval, the random-walk rate, the difference in points and a verdict.
WHAT IS ORIGINAL HERE
ATR stop and trailing-stop tools draw levels; they do not say how often price reaches them, or would by chance. Here the chance has a closed form. For driftless Brownian motion in log price with volatility sigma per bar, the probability of touching a level at log distance d within N bars is 2 x Phi(-d / (sigma x sqrt(N))), by the reflection principle. Each resolved event gets that prediction from its own entry, ATR and sigma, so the measured rate and the random-walk rate come from the same bars. Pine has no normal distribution function, so Phi is built from the Abramowitz and Stegun 7.1.26 approximation of erf, with an error below 1e-7. A volatility row adds a check that does not depend on the stops: the expected range of a Brownian bar is about 1.6 sigma, so an ATR / sigma ratio far from 1.6 says the bars do not move like a random walk.
HOW IT IS MEASURED
- Entry: the close of a confirmed bar, once the ATR and the volatility window are ready. An event resolves N bars after its entry (20 by default), and the next one can start on that bar, so entries are at least N bars apart.
- ATR: ta.atr(14) on the entry bar. Sigma: the sample standard deviation of the 100 one-bar log returns that end at the entry bar (defaults).
- Stops: entry - k x ATR and entry + k x ATR; a hit is a touch by a low or a high of the N bars after the entry.
- Prediction: d = log distance from the entry to the stop, rate = 2 x Phi(-d / (sigma x sqrt(N))), averaged over both sides of all events.
- Interval: the event is the unit, because its long and short outcomes share the same bars.
- Counters move only on confirmed bars; the event still open on the last bar is not counted. No request.security call.
HOW TO USE IT
1. Keep the defaults first, then set the horizon to the bars you would hold a position.
2. Read the "difference" column: the pooled hit rate minus the random-walk rate, in points.
3. Read the verdict: "like a random walk" when the random-walk rate lies inside the interval, "hit more than a random walk" when it lies below it, "hit less than a random walk" when it lies above it; "(small sample)" under 30 events.
4. Read the volatility row: with an ATR / sigma ratio far from 1.6 the bars are not random-walk bars, and the verdicts reflect that too.
5. Set Stop 1 to 0.1: that row should read near 100%. Set the horizon to 1: every row should be small.
HOW TO READ THE TABLE
Header: symbol, timeframe, ATR length, volatility window, horizon.
One row per stop: events, long hit, short hit, pooled hit, 95% CI, random walk, difference, verdict.
Volatility: mean ATR as % of price, mean sigma per bar, their ratio, the Brownian reference 1.60, confirmed bars and events.
Last event: entry time, close, ATR, the lowest low and the highest high of its N bars in ATRs from the entry, and the open event that is not counted yet.
LIMITATIONS
- The null is a driftless random walk with a constant volatility per event. A trend, a change of volatility, mean reversion or fat tails can move the hit rates away from it; the verdict says that the chart differs, not why.
- Sigma comes from 100 returns and has an error of about 7% of its own, which the interval does not include.
- The ATR and sigma windows react to a change of volatility at different speeds.
- A hit is a touch of the high or the low: no fills, slippage or costs, and no order between the long and the short stop.
- Highs and lows carry the bid-ask bounce one way, closes with either sign; on thin symbols or low timeframes it inflates the ATR against sigma and the hits at tight stops.
- Use standard candles; Heikin Ashi or Renko bars change the highs and lows.
- Entries are spaced from the first loaded bar, so history depth, symbol and timeframe change the result. Counts, not a trading rule. Not financial advice.
The chart shows BINANCE:BTCUSDT on the 1 hour timeframe with the default settings. The table is in the bottom right.
A stop placed a few ATRs from price is meant to sit outside the noise. This indicator counts how often price reaches it anyway, and compares that count with what a pure random walk of the same volatility would give. At regular entries that never overlap, it places a long stop and a short stop at 1, 1.5, 2 and 3 ATRs (defaults) from the close and checks the next N bars: the lows for the long stop, the highs for the short stop. For each multiple the table on the last bar shows the long, short and pooled hit rates with a 95% confidence interval, the random-walk rate, the difference in points and a verdict.
WHAT IS ORIGINAL HERE
ATR stop and trailing-stop tools draw levels; they do not say how often price reaches them, or would by chance. Here the chance has a closed form. For driftless Brownian motion in log price with volatility sigma per bar, the probability of touching a level at log distance d within N bars is 2 x Phi(-d / (sigma x sqrt(N))), by the reflection principle. Each resolved event gets that prediction from its own entry, ATR and sigma, so the measured rate and the random-walk rate come from the same bars. Pine has no normal distribution function, so Phi is built from the Abramowitz and Stegun 7.1.26 approximation of erf, with an error below 1e-7. A volatility row adds a check that does not depend on the stops: the expected range of a Brownian bar is about 1.6 sigma, so an ATR / sigma ratio far from 1.6 says the bars do not move like a random walk.
HOW IT IS MEASURED
- Entry: the close of a confirmed bar, once the ATR and the volatility window are ready. An event resolves N bars after its entry (20 by default), and the next one can start on that bar, so entries are at least N bars apart.
- ATR: ta.atr(14) on the entry bar. Sigma: the sample standard deviation of the 100 one-bar log returns that end at the entry bar (defaults).
- Stops: entry - k x ATR and entry + k x ATR; a hit is a touch by a low or a high of the N bars after the entry.
- Prediction: d = log distance from the entry to the stop, rate = 2 x Phi(-d / (sigma x sqrt(N))), averaged over both sides of all events.
- Interval: the event is the unit, because its long and short outcomes share the same bars.
- Counters move only on confirmed bars; the event still open on the last bar is not counted. No request.security call.
HOW TO USE IT
1. Keep the defaults first, then set the horizon to the bars you would hold a position.
2. Read the "difference" column: the pooled hit rate minus the random-walk rate, in points.
3. Read the verdict: "like a random walk" when the random-walk rate lies inside the interval, "hit more than a random walk" when it lies below it, "hit less than a random walk" when it lies above it; "(small sample)" under 30 events.
4. Read the volatility row: with an ATR / sigma ratio far from 1.6 the bars are not random-walk bars, and the verdicts reflect that too.
5. Set Stop 1 to 0.1: that row should read near 100%. Set the horizon to 1: every row should be small.
HOW TO READ THE TABLE
Header: symbol, timeframe, ATR length, volatility window, horizon.
One row per stop: events, long hit, short hit, pooled hit, 95% CI, random walk, difference, verdict.
Volatility: mean ATR as % of price, mean sigma per bar, their ratio, the Brownian reference 1.60, confirmed bars and events.
Last event: entry time, close, ATR, the lowest low and the highest high of its N bars in ATRs from the entry, and the open event that is not counted yet.
LIMITATIONS
- The null is a driftless random walk with a constant volatility per event. A trend, a change of volatility, mean reversion or fat tails can move the hit rates away from it; the verdict says that the chart differs, not why.
- Sigma comes from 100 returns and has an error of about 7% of its own, which the interval does not include.
- The ATR and sigma windows react to a change of volatility at different speeds.
- A hit is a touch of the high or the low: no fills, slippage or costs, and no order between the long and the short stop.
- Highs and lows carry the bid-ask bounce one way, closes with either sign; on thin symbols or low timeframes it inflates the ATR against sigma and the hits at tight stops.
- Use standard candles; Heikin Ashi or Renko bars change the highs and lows.
- Entries are spaced from the first loaded bar, so history depth, symbol and timeframe change the result. Counts, not a trading rule. Not financial advice.
The chart shows BINANCE:BTCUSDT on the 1 hour timeframe with the default settings. The table is in the bottom right.

Custom Pine Script v6: indicators, strategies, alerts, with look-ahead and repaint checks. Backtest audits in Python.
Hire me on Upwork: upwork.com/freelancers/~01fa3c5136b53674c8
Proofs on GitHub: github.com/guillemustafa-ux
Hire me on Upwork: upwork.com/freelancers/~01fa3c5136b53674c8
Proofs on GitHub: github.com/guillemustafa-ux
Exención de responsabilidad
La información y las publicaciones no constituyen, ni deben considerarse como, asesoramiento o recomendaciones financieras, de inversión, de trading u otro tipo, proporcionadas o respaldadas por TradingView. Obtenga más información en Condiciones de uso.
Custom Pine Script v6: indicators, strategies, alerts, with look-ahead and repaint checks. Backtest audits in Python.
Hire me on Upwork: upwork.com/freelancers/~01fa3c5136b53674c8
Proofs on GitHub: github.com/guillemustafa-ux
Hire me on Upwork: upwork.com/freelancers/~01fa3c5136b53674c8
Proofs on GitHub: github.com/guillemustafa-ux
Exención de responsabilidad
La información y las publicaciones no constituyen, ni deben considerarse como, asesoramiento o recomendaciones financieras, de inversión, de trading u otro tipo, proporcionadas o respaldadas por TradingView. Obtenga más información en Condiciones de uso.