Weekly Profile (Side Panel)
Weekly Profile (Side Panel)
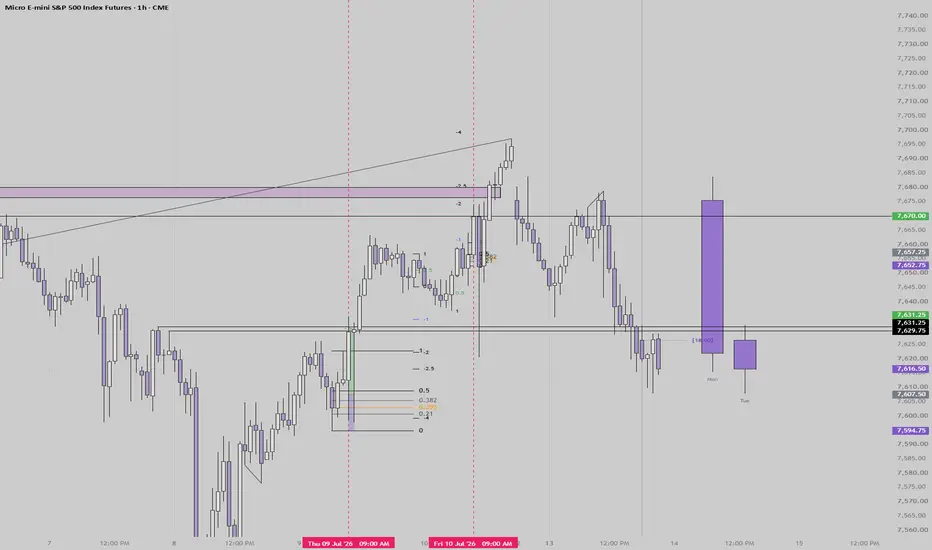
Builds a live, day-by-day "weekly profile" of daily candles and displays them as a compact panel off to the side of live price, on any chart timeframe of 4H or lower.
How it works:
- Each trading day is defined using the standard futures/forex session convention: 18:00 ET to 18:00 ET the next day. Sunday 18:00 ET marks the start of the "Monday" session.
- As the week progresses, the indicator accumulates a running Open/High/Low/Close for each weekday from the lower-timeframe bars on your chart, effectively reconstructing what the daily candle would look like.
- On Monday, only the Monday candle is shown, updating live. On Tuesday, Monday (finalized) and Tuesday (live) are both shown. This continues through Friday.
- When the Friday session closes and the next Monday session opens, the whole panel resets and rebuilds for the new week.
Display:
- The 5 daily candles are drawn as boxes (bodies) with wick lines, positioned in a fixed panel to the right of the live price action rather than overlaid on the real bars.
- Body fill color reflects up/down, with a separate customizable border color/width so the bodies are clearly outlined.
- Optional Mon/Tue/Wed/Thu/Fri labels under each candle.
- Gap from live price, candle width, and spacing between candles are all adjustable inputs.
Notes:
- Only runs on timeframes of 4H or lower; on higher timeframes it shows a warning label instead.
- Designed for instruments with real session gaps (futures, forex); on 24/7 feeds the reset still triggers off the NY 18:00 boundary but there's no actual market closure to align it with.
Builds a live, day-by-day "weekly profile" of daily candles and displays them as a compact panel off to the side of live price, on any chart timeframe of 4H or lower.
How it works:
- Each trading day is defined using the standard futures/forex session convention: 18:00 ET to 18:00 ET the next day. Sunday 18:00 ET marks the start of the "Monday" session.
- As the week progresses, the indicator accumulates a running Open/High/Low/Close for each weekday from the lower-timeframe bars on your chart, effectively reconstructing what the daily candle would look like.
- On Monday, only the Monday candle is shown, updating live. On Tuesday, Monday (finalized) and Tuesday (live) are both shown. This continues through Friday.
- When the Friday session closes and the next Monday session opens, the whole panel resets and rebuilds for the new week.
Display:
- The 5 daily candles are drawn as boxes (bodies) with wick lines, positioned in a fixed panel to the right of the live price action rather than overlaid on the real bars.
- Body fill color reflects up/down, with a separate customizable border color/width so the bodies are clearly outlined.
- Optional Mon/Tue/Wed/Thu/Fri labels under each candle.
- Gap from live price, candle width, and spacing between candles are all adjustable inputs.
Notes:
- Only runs on timeframes of 4H or lower; on higher timeframes it shows a warning label instead.
- Designed for instruments with real session gaps (futures, forex); on 24/7 feeds the reset still triggers off the NY 18:00 boundary but there's no actual market closure to align it with.

Exención de responsabilidad
La información y las publicaciones no constituyen, ni deben considerarse como, asesoramiento o recomendaciones financieras, de inversión, de trading u otro tipo, proporcionadas o respaldadas por TradingView. Obtenga más información en Condiciones de uso.
Exención de responsabilidad
La información y las publicaciones no constituyen, ni deben considerarse como, asesoramiento o recomendaciones financieras, de inversión, de trading u otro tipo, proporcionadas o respaldadas por TradingView. Obtenga más información en Condiciones de uso.