OPEN-SOURCE SCRIPT
Actualizado Diff Price (Future - Spot)
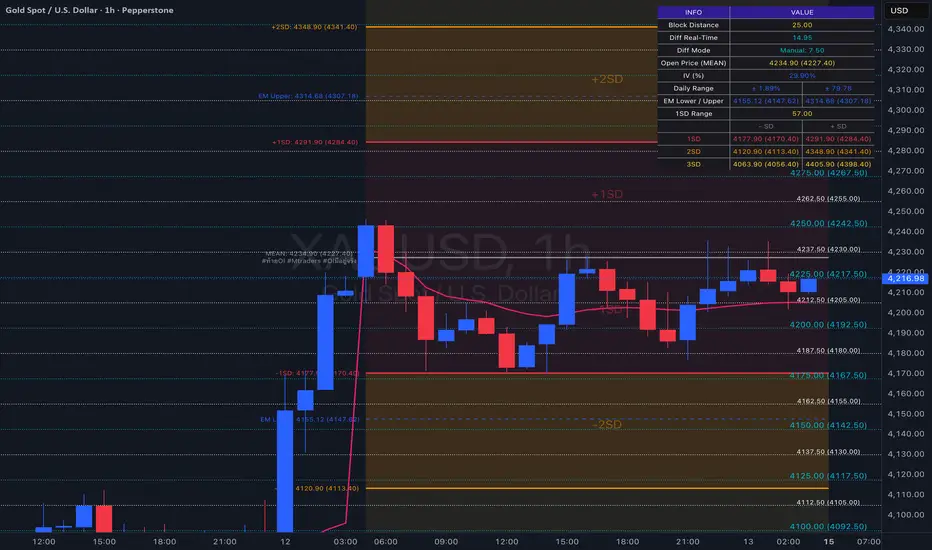
Diff Line (Future – Spot) plots a grid of spot-price levels derived from the current futures price.
It rounds the current futures price up to the nearest price block (e.g. every 25 points), then subtracts a user‑defined Diff (Future – Spot) to find the main spot level and draws that as the central line. Additional lines are plotted above and below at equal block distances, with labels showing both Future and Spot values (e.g. 4250 (4215)), plus a compact diff info box for quick reference.
It rounds the current futures price up to the nearest price block (e.g. every 25 points), then subtracts a user‑defined Diff (Future – Spot) to find the main spot level and draws that as the central line. Additional lines are plotted above and below at equal block distances, with labels showing both Future and Spot values (e.g. 4250 (4215)), plus a compact diff info box for quick reference.
Notas de prensa
Diff Price (Future – Spot)This script draws horizontal price levels based on the difference between a Futures chart and its Spot price.
It calculates a “main” Spot level from the current Futures price and the input Diff value, then plots equally spaced lines above and below that level.
How it works
- Assumes the current chart is the Futures price.
- Rounds the Futures price to the nearest grid defined by Block Trade Distance.
- Computes the main Spot level as: Future block – Diff (Future – Spot).
- Draws the main line plus a user‑defined total number of lines above and below, spaced by the block distance.
- Optional labels show both prices in the format Future (Spot).
Basic usage
- Add the script to a Futures chart.
- Set Block Trade Distance to your desired grid size (e.g. 25).
- Set Diff (Future – Spot) to the current spread between Futures and Spot.
- Adjust Total number of lines (including main line) to control how many levels are shown.
- (Optional) Customize line color, style, and label appearance in the settings.
Use these levels to visualize where Futures and Spot prices align across a consistent grid of price blocks.
Notas de prensa
Diff Price (Future – Spot)This script draws horizontal price levels based on the difference between a Futures chart and its Spot price. It now supports both full‑block and half‑block levels.
How it works
- Assumes the current chart is the Futures price.
- Rounds the Futures price to the nearest grid defined by Block Trade Distance.
- Computes the main Spot level as:
Spot main = Future block − Diff (Future – Spot)
- Draws the main line plus a user‑defined total number of full‑block lines above and below, spaced by the block distance.
- Between every adjacent pair of full‑block levels, draws half‑block lines at half the block distance.
- Half‑block lines use a different, less prominent color and thinner style.
- Full‑block labels show both prices in the format Future (Spot).
- Half‑block labels are smaller and show only the Spot price, to keep the grid readable.
- A small table in the top‑right corner shows the current Block Distance and Diff (Future – Spot).
Basic usage
- Add the script to a Futures chart.
- Set Block Trade Distance to your desired grid size (e.g. 25).
- Set Diff (Future – Spot) to the current spread between Futures and Spot.
- Adjust Total number of lines (including main line) to control how many full‑block levels are shown.
- In the settings:
- Use the FULL‑BLOCK section to configure main grid color, style, and labels.
- Use the HALF‑BLOCK section to enable/disable half‑block lines and customize their appearance and labels.
Use these levels to visualize where Futures and Spot prices align across a consistent grid of price blocks, with half‑block lines providing finer intermediate levels without overwhelming the chart.
Notas de prensa
✨ Auto Diff Calculation Feature:- Added a new "Use Auto Diff" toggle in the settings.
- The script can now automatically calculate the price difference by fetching real-time data from a specified Future symbol (Default: BLACKBULL:GOLD.F) and subtracting the current Spot price.
📊 Redesigned Information Table:
- Completely overhauled the on-screen table into a clean, modern 2-column layout (ITEM & VALUE) with a custom-colored header.
- The table now displays the real-time "Future Price" for quick reference.
- Merged the "Diff (Future - Spot)" cells for a much cleaner and professional look.
💡 Dynamic Mode Indicator:
- Both Manual and Auto Diff values are now displayed simultaneously in the table.
- The text color dynamically changes based on your active mode (Active mode is highlighted in White, while the inactive mode is dimmed to Gray).
⚙️ Optimized Default Settings:
- Adjusted the default input values for a better out-of-the-box experience.
- Label backgrounds are now set to transparent by default.
- Label X-offset is optimized to 5.
- Half-block text color defaults to White for better readability.
Notas de prensa
Bug fixNotas de prensa
bug fixNotas de prensa
bug fixNotas de prensa
📊 Advanced Volatility Analytics (Expected Move)We have upgraded the Information Table to include institutional-grade Implied Volatility (IV) calculations, allowing you to gauge the daily market range directly from the table:
- Annual IV: You can now input the Implied Volatility (Vol Settle) directly from CME Options data.
- Daily Move (%): Automatically calculates the expected daily percentage movement using the industry-standard "Rule of 16".
- Daily Move (pts): Converts the daily percentage into exact price points based on the Daily Spot Open, giving you a precise +/- range for the day.
⚙️ UI & Stability Improvements
- Anti-Jitter Table: Fixed an issue where the table size would jump or glitch when prices fluctuated. Column widths are now strictly locked, and all values are formatted to 2 decimal places (#.00) for a 100% stable viewing experience.
Notas de prensa
bug fixNotas de prensa
minor bug fixNotas de prensa
minor bug fixNotas de prensa
minor bug fixNotas de prensa
minor bug fixNotas de prensa
Update Standard DeviationMinor Bug Fix
Notas de prensa
minor bug fixNotas de prensa
- VRP Discount- Minor bug fix
- Optimize code
Notas de prensa
-Update SD and Triangle-Minor bug fix
Notas de prensa
- SD Zone Fill — Linefill between SD levels (±1SD / ±2SD / ±3SD) with individual color and opacity controls (default 15%)
- SD Triangle Customization — Color, opacity, line width, and line style now configurable
- Daily Range display — Table now shows both pts and %
- Base Price (EM) expanded — Added Daily Future Open and Custom Future Price options alongside Daily Spot Open and Current Price; includes dedicated future symbol input (default: GC1!)
- MEAN Source (SD) expanded — Added Daily Future Open option with dedicated future symbol input (default: GC1!)
- Default changed to Daily Future Open — Both Base Price and MEAN Source default to live future open
- Auto zero-diff on Future chart — When the chart symbol matches the reference future symbol, diff is automatically set to 0
Notas de prensa
Performance- Merged duplicate future symbol inputs into one
- Cached square root constant — computed once per session
- Pre-allocated all block lines on first bar
- Merged all drawing logic into a single last-bar block
Input Structure
- Added Morning Setup group at the top for daily values
- Renamed and reorganized input groups
- Moved future symbol input to Diff Settings
- Removed all input tooltips
SD Zone Fill
- Fill colors now match SD line colors
- Default opacity set to 7%
Notas de prensa
-Minor Bug FixNotas de prensa
-Minor Bug FixNotas de prensa
-Minor Bug FixNotas de prensa
-Minor Bug FixNotas de prensa
- Minor Bug FixNotas de prensa
- Update Table Info- Minor Bug Fix
Notas de prensa
- Update Table Info- Minor Bug Fix
Notas de prensa
- Add Alert Feature- Minor Bug Fix
Notas de prensa
- Update Pine Script to Version 6- Minor Bug Fix
Notas de prensa
- Update Table Info- Minor Bug Fix
Notas de prensa
- Minor Bug FixNotas de prensa
-Minor Bug FixNotas de prensa
- Bug FixNotas de prensa
Added 1SD Range Mode setting (Auto / Manual) under SETTING.- Auto: Calculates 1SD Range dynamically. DTE is configurable (default 0.6).
- Manual: Uses the fixed value entered in Manual 1SD Range under MORNING SETUP.
Notas de prensa
Naming & Labeling- Renamed "Manual 1SD Range" → "Manual SD Range", "1SD Range Mode" → "SD Range Mode", option "Auto" → "Calculated"
- Table Info: "1SD Range" → "SD Range"
Tooltips
- Added explanatory tooltips for Diff Price Mode, Open Price (MEAN) Mode, SD Range Mode, Price Label, and FB/HB Label Position
Colors & Sizes
- MEAN line/label → solid neon green (#39FF14)
- Default SD Label Size = Normal, FB Label Size = Normal
Label Positioning
- Added SD Label Position, EM Label Position (Left/Center/Right)
- Added FB/HB Label Position (Fixed/Follow — Follow tracks the center of the visible chart on scroll/zoom; default = Follow)
Line Visibility
- Added "Show FB Lines"
- Changed the SD/EM/MEAN line-hiding mechanism from "na coordinates" to "100% transparent" (values still calculated, zone fill no longer disappears)
- Added "Hide SD/EM on 1D or Above" (default = Hide) — hides SD, EM, MEAN, and Triangle lines/labels on daily-and-above timeframes
Table Info
- Added DTE to the SD Range row: SD Range | 56.00 (DTE 0.60) — the (DTE ...) part auto-hides when using Manual mode
Script de código abierto
Fiel al espíritu de TradingView, el creador de este script lo ha convertido en código abierto, para que los traders puedan revisar y verificar su funcionalidad. ¡Enhorabuena al autor! Aunque puede utilizarlo de forma gratuita, recuerde que cualquier republicación del código está sujeta a nuestras Normas internas.

Exención de responsabilidad
La información y las publicaciones no constituyen, ni deben considerarse como, asesoramiento o recomendaciones financieras, de inversión, de trading u otro tipo, proporcionadas o respaldadas por TradingView. Obtenga más información en Condiciones de uso.
Script de código abierto
Fiel al espíritu de TradingView, el creador de este script lo ha convertido en código abierto, para que los traders puedan revisar y verificar su funcionalidad. ¡Enhorabuena al autor! Aunque puede utilizarlo de forma gratuita, recuerde que cualquier republicación del código está sujeta a nuestras Normas internas.
Exención de responsabilidad
La información y las publicaciones no constituyen, ni deben considerarse como, asesoramiento o recomendaciones financieras, de inversión, de trading u otro tipo, proporcionadas o respaldadas por TradingView. Obtenga más información en Condiciones de uso.