OPEN-SOURCE SCRIPT
Dee MTF ATR Strategy + Alert (3 TPs)
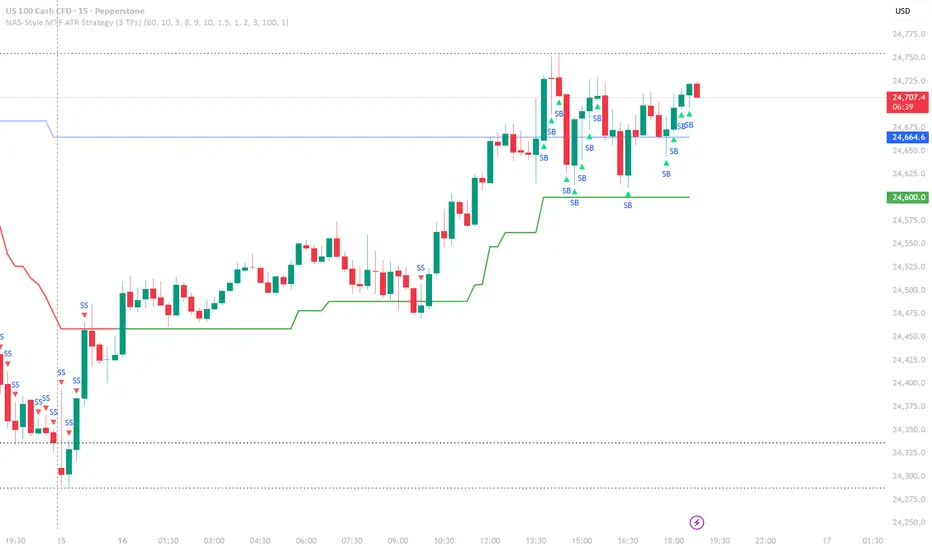
Dee MTF ATR Strategy follows these 7 clear, mechanical rules for entries, exits, and risk.
Entry Rules
Long Entry (Strong Buy)
Condition 1: LTF Supertrend is bullish (price above LTF Supertrend line).
Condition 2: HTF Supertrend is bullish (higher timeframe Supertrend direction = +1).
Condition 3: Fast SMA(8) ≥ Slow SMA(9) (momentum alignment).
Execution: Enter long at next bar’s open after all 3 conditions align.
Short Entry (Strong Sell)
Condition 1: LTF Supertrend is bearish (price below LTF Supertrend line).
Condition 2: HTF Supertrend is bearish (higher timeframe Supertrend direction = -1).
Condition 3: Fast SMA(8) ≤ Slow SMA(9) (momentum alignment).
Execution: Enter short at next bar’s open after all 3 conditions align.
Position rules: Only 1 position at a time (no pyramiding). No entry if already in a trade.
Exit Rules
For Long Trades
SL: Entry price - (ATR × 1.5) → dynamic trailing stop.
TP1: Entry price + (1.0 × Risk Distance) → exit 33% of position.
TP2: Entry price + (2.0 × Risk Distance) → exit 33% of position.
TP3: Entry price + (3.0 × Risk Distance) → exit 34% of position.
For Short Trades
SL: Entry price + (ATR × 1.5) → dynamic trailing stop.
TP1: Entry price - (1.0 × Risk Distance) → exit 33% of position.
TP2: Entry price - (2.0 × Risk Distance) → exit 33% of position.
TP3: Entry price - (3.0 × Risk Distance) → exit 34% of position.
Risk Distance = |Entry - SL| (so TP1 = 1R, TP2 = 2R, TP3 = 3R).
Risk Management Rules
Position Size:
Fixed: fixedQty contracts (default 1.0).
OR Risk‑based: Size so that SL hit = riskUsdPerTrade (default $100).
Commission: 0.01% per side (adjustable).
Order fill: On bar close (avoids intrabar repainting).
Visual Confirmation Checklist
When you see a SB (Strong Buy) triangle:
Blue HTF Supertrend line should be flat/up (not down).
Green LTF Supertrend line should be below price.
SMA(8) line above or touching SMA(9) line.
When you see a SS (Strong Sell) triangle:
Blue HTF Supertrend line should be flat/down (not up).
Red LTF Supertrend line should be above price.
SMA(8) line below or touching SMA(9) line.
Example Trade Plan (5m NAS100)
Strong Buy signal appears at 1.7500:
Entry: 1.7500
ATR(10): 0.0020
SL: 1.7500 - (1.5 × 0.0020) = 1.7470 (Risk = 30 points)
TP1: 1.7500 + (1 × 30) = 1.7530 (33% out)
TP2: 1.7500 + (2 × 30) = 1.7560 (33% out)
TP3: 1.7500 + (3 × 30) = 1.7590 (34% out)
Strategy Logic Summary
Core idea: Trade only when LTF momentum aligns with HTF trend, using ATR for objective risk/reward scaling.
Edge assumption: HTF trend filter reduces whipsaws, LTF momentum catches pullbacks into trend, 3R scaling captures trend continuation.
Entry Rules
Long Entry (Strong Buy)
Condition 1: LTF Supertrend is bullish (price above LTF Supertrend line).
Condition 2: HTF Supertrend is bullish (higher timeframe Supertrend direction = +1).
Condition 3: Fast SMA(8) ≥ Slow SMA(9) (momentum alignment).
Execution: Enter long at next bar’s open after all 3 conditions align.
Short Entry (Strong Sell)
Condition 1: LTF Supertrend is bearish (price below LTF Supertrend line).
Condition 2: HTF Supertrend is bearish (higher timeframe Supertrend direction = -1).
Condition 3: Fast SMA(8) ≤ Slow SMA(9) (momentum alignment).
Execution: Enter short at next bar’s open after all 3 conditions align.
Position rules: Only 1 position at a time (no pyramiding). No entry if already in a trade.
Exit Rules
For Long Trades
SL: Entry price - (ATR × 1.5) → dynamic trailing stop.
TP1: Entry price + (1.0 × Risk Distance) → exit 33% of position.
TP2: Entry price + (2.0 × Risk Distance) → exit 33% of position.
TP3: Entry price + (3.0 × Risk Distance) → exit 34% of position.
For Short Trades
SL: Entry price + (ATR × 1.5) → dynamic trailing stop.
TP1: Entry price - (1.0 × Risk Distance) → exit 33% of position.
TP2: Entry price - (2.0 × Risk Distance) → exit 33% of position.
TP3: Entry price - (3.0 × Risk Distance) → exit 34% of position.
Risk Distance = |Entry - SL| (so TP1 = 1R, TP2 = 2R, TP3 = 3R).
Risk Management Rules
Position Size:
Fixed: fixedQty contracts (default 1.0).
OR Risk‑based: Size so that SL hit = riskUsdPerTrade (default $100).
Commission: 0.01% per side (adjustable).
Order fill: On bar close (avoids intrabar repainting).
Visual Confirmation Checklist
When you see a SB (Strong Buy) triangle:
Blue HTF Supertrend line should be flat/up (not down).
Green LTF Supertrend line should be below price.
SMA(8) line above or touching SMA(9) line.
When you see a SS (Strong Sell) triangle:
Blue HTF Supertrend line should be flat/down (not up).
Red LTF Supertrend line should be above price.
SMA(8) line below or touching SMA(9) line.
Example Trade Plan (5m NAS100)
Strong Buy signal appears at 1.7500:
Entry: 1.7500
ATR(10): 0.0020
SL: 1.7500 - (1.5 × 0.0020) = 1.7470 (Risk = 30 points)
TP1: 1.7500 + (1 × 30) = 1.7530 (33% out)
TP2: 1.7500 + (2 × 30) = 1.7560 (33% out)
TP3: 1.7500 + (3 × 30) = 1.7590 (34% out)
Strategy Logic Summary
Core idea: Trade only when LTF momentum aligns with HTF trend, using ATR for objective risk/reward scaling.
Edge assumption: HTF trend filter reduces whipsaws, LTF momentum catches pullbacks into trend, 3R scaling captures trend continuation.
Script de código abierto
Fiel al espíritu de TradingView, el creador de este script lo ha convertido en código abierto, para que los traders puedan revisar y verificar su funcionalidad. ¡Enhorabuena al autor! Aunque puede utilizarlo de forma gratuita, recuerde que cualquier republicación del código está sujeta a nuestras Normas internas.

Exención de responsabilidad
La información y las publicaciones no constituyen, ni deben considerarse como, asesoramiento o recomendaciones financieras, de inversión, de trading u otro tipo, proporcionadas o respaldadas por TradingView. Obtenga más información en Condiciones de uso.
Script de código abierto
Fiel al espíritu de TradingView, el creador de este script lo ha convertido en código abierto, para que los traders puedan revisar y verificar su funcionalidad. ¡Enhorabuena al autor! Aunque puede utilizarlo de forma gratuita, recuerde que cualquier republicación del código está sujeta a nuestras Normas internas.
Exención de responsabilidad
La información y las publicaciones no constituyen, ni deben considerarse como, asesoramiento o recomendaciones financieras, de inversión, de trading u otro tipo, proporcionadas o respaldadas por TradingView. Obtenga más información en Condiciones de uso.