Volume Momentum Index [SMRT Algo]
Volume Momentum Index [SMRT Algo]
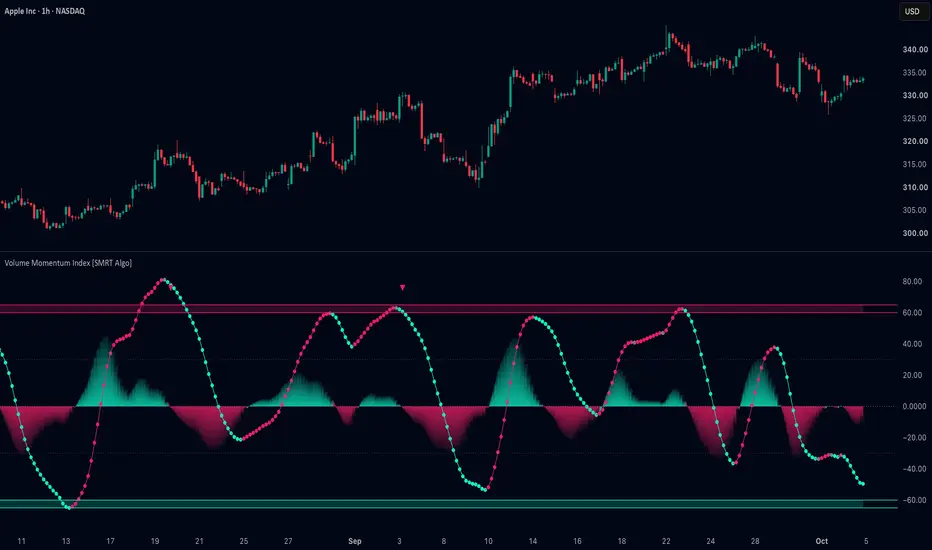
Volume Momentum Index (VMI) is a free, open-source momentum indicator that combines closing-price movement with relative volume. It helps users study momentum swings, changes in momentum relative to a signal line, and potential reversal conditions near the oscillator's extremes.
The indicator appears in a separate pane with a smoothed momentum curve, a histogram, reference zones, and conditional reversal markers. It is designed as an analytical aid, with price context used to assess what those readings mean.
Chart overview

The annotations identify the main visual features. They illustrate indicator behavior, rather than documented trade results. The drawings were added manually and are not generated by the script.
How it works
VMI starts with the difference between the current close and the close a selected number of bars ago. It compares that change with an exponential moving average (EMA) of its absolute magnitude, producing a relative price-momentum reading.
It then compares current volume with its own EMA. The direction of the latest close-to-close change supplies the sign of this volume adjustment. The adjustment is bounded to limit the effect of unusually large volume readings.
The volume formula is asymmetric: up-close bars increase the multiplier applied to price momentum, while down-close bars decrease it. This does not mean that volume always amplifies movement in either direction, and it does not measure actual buying or selling volume delta.
The adjusted result is smoothed, scaled against the largest absolute reading within a rolling window, and smoothed again. A further EMA provides the signal series. This combination produces a relative oscillator whose readings depend on recent market conditions, rather than a fixed percentage change in price.
Reading the indicator
Reversal markers
A turquoise upward triangle appears at the bottom of the pane when VMI crosses above its signal while both values are below the Oversold Level.
A pink downward triangle appears at the top of the pane when VMI crosses below its signal while both values are above the Overbought Level.
Both conditions use strict comparisons. Touching a threshold alone does not qualify, and a crossover outside the required extreme region does not produce a marker. Markers identify potential momentum reversals; they do not confirm a price reversal or specify an entry price.
Settings
Defaults are starting values, not optimized settings for every market. Keep reference levels in a sensible order around zero. Moving extreme thresholds toward zero can allow more qualifying crossovers; moving them farther away makes the filter more restrictive. The curve-color slope threshold and ATR length are fixed in the source.
Example ways to use VMI
These examples are hypothetical reading scenarios, not backtests or claims of profitable trades. Price structure, support, and resistance are assessed manually.
Alerts and live updates
The script provides two alert conditions: Bullish VMI Reversal and Bearish VMI Reversal. Add the indicator to the chart, create a TradingView alert, and select the desired condition.
The indicator recalculates on the open bar. Price and volume changes can cause readings and markers to appear or disappear before the bar closes. Select Once Per Bar Close when the alert should require the condition at the close. Recreate alerts after changing relevant settings, the script, symbol, or timeframe so they use the new configuration.
The script uses current-chart data and past values, with no higher-timeframe requests, lookahead, or markers shifted into previous bars. Its live-bar behavior still means an unqualified “non-repainting” claim would be misleading.
Limitations and open-source availability
VMI requires usable volume data and has no explicit fallback for missing volume. Depending on the selected feed, volume may represent traded volume or tick activity. Smoothing adds lag, and rolling normalization changes the scale as recent extremes enter or leave the window. Use standard candles or bars when evaluating its behavior.
This is an indicator, not an automated strategy. It does not place orders, calculate trading performance, or supply position sizing, stops, or targets. No win rate or profitability claim is made.
The publication is free and open source, with Pine Script v6 code provided under the Mozilla Public License 2.0 stated in the source. Users can inspect the implementation and study or adapt it subject to that license. Its purpose is market analysis and education.
Volume Momentum Index (VMI) is a free, open-source momentum indicator that combines closing-price movement with relative volume. It helps users study momentum swings, changes in momentum relative to a signal line, and potential reversal conditions near the oscillator's extremes.
The indicator appears in a separate pane with a smoothed momentum curve, a histogram, reference zones, and conditional reversal markers. It is designed as an analytical aid, with price context used to assess what those readings mean.
Chart overview
The annotations identify the main visual features. They illustrate indicator behavior, rather than documented trade results. The drawings were added manually and are not generated by the script.
How it works
VMI starts with the difference between the current close and the close a selected number of bars ago. It compares that change with an exponential moving average (EMA) of its absolute magnitude, producing a relative price-momentum reading.
It then compares current volume with its own EMA. The direction of the latest close-to-close change supplies the sign of this volume adjustment. The adjustment is bounded to limit the effect of unusually large volume readings.
The volume formula is asymmetric: up-close bars increase the multiplier applied to price momentum, while down-close bars decrease it. This does not mean that volume always amplifies movement in either direction, and it does not measure actual buying or selling volume delta.
The adjusted result is smoothed, scaled against the largest absolute reading within a rolling window, and smoothed again. A further EMA provides the signal series. This combination produces a relative oscillator whose readings depend on recent market conditions, rather than a fixed percentage change in price.
Reading the indicator
- Smoothed momentum curve: The visible curve is the average of VMI and its signal. The individual VMI and signal lines are hidden in this version. Above zero, their average is positive; below zero, it is negative.
- Curve colors: Pink indicates a sufficiently rising curve, turquoise indicates a sufficiently falling curve, and gray indicates movement within the slope threshold. These colors describe the curve's movement, not buy and sell instructions. The slope test uses ATR, so its sensitivity varies across instruments and timeframes.
- Histogram: Displays VMI minus its signal. Turquoise means VMI is above its signal; pink means it is below. Larger bars show greater separation, while bars approaching zero show the gap narrowing. A positive histogram can occur while the momentum curve is below zero, and vice versa.
- Reference zones: Upper and lower shaded bands highlight elevated and depressed momentum. The dotted lines provide additional visual reference points. Extreme readings can persist during strong trends.
Reversal markers
A turquoise upward triangle appears at the bottom of the pane when VMI crosses above its signal while both values are below the Oversold Level.
A pink downward triangle appears at the top of the pane when VMI crosses below its signal while both values are above the Overbought Level.
Both conditions use strict comparisons. Touching a threshold alone does not qualify, and a crossover outside the required extreme region does not produce a marker. Markers identify potential momentum reversals; they do not confirm a price reversal or specify an entry price.
Settings
- Momentum Length (14): Controls the price-change lookback and the averages used for price normalization and relative volume. Shorter lengths focus on more recent movement; longer lengths examine a broader interval.
- Base Smoothing Length (5): Smooths the volume-adjusted momentum before normalization. Higher values generally reduce short-term variation and add lag.
- VMI Smooth Length (5): Applies two consecutive EMAs after normalization. Higher values create a smoother VMI; lower values make it more responsive.
- Signal Length (9): Sets the EMA length of the signal. It affects the histogram, visible curve, and crossover timing. A value of 1 makes the signal equal to VMI, leaving no histogram separation or reversal crossovers.
- Volume Influence (0.75): Controls the strength of the signed relative-volume adjustment. Zero removes this adjustment when volume data is valid. Values above 1 can reverse the raw momentum sign on sufficiently strong down-close volume readings.
- Normalization Length (50): Sets the rolling window used to scale the oscillator. A longer window retains past extremes for longer; a shorter window adapts sooner as those extremes leave the window.
- Overbought Level (60): Sets the upper reversal threshold and the beginning of the upper shaded band, which extends five points higher.
- Upper Level (30): A visual guide; it does not trigger reversal alerts.
- Lower Level (-30): A visual guide; it does not trigger reversal alerts.
- Oversold Level (-60): Sets the lower reversal threshold and the beginning of the lower shaded band, which extends five points lower.
- Art colors: Customize the turquoise, pink, and gray colors without changing calculations or signal conditions.
Defaults are starting values, not optimized settings for every market. Keep reference levels in a sensible order around zero. Moving extreme thresholds toward zero can allow more qualifying crossovers; moving them farther away makes the filter more restrictive. The curve-color slope threshold and ATR length are fixed in the source.
Example ways to use VMI
These examples are hypothetical reading scenarios, not backtests or claims of profitable trades. Price structure, support, and resistance are assessed manually.
- Following a pullback: During an upward price trend, the histogram may turn negative as momentum softens. A return above zero shows VMI recovering above its signal. A user can compare that change with whether price preserves its previous swing low. This can occur without a reversal triangle.
- Reviewing a possible rebound: A bullish marker near a manually identified support area can draw attention to an improving momentum relationship. A user can then look for price stabilization or a reclaimed level. Price may still continue falling after the marker.
- Reviewing a weakening advance: A bearish marker near resistance can prompt a closer look at whether an advance is losing momentum. It does not establish that a market top is in place; strong trends can resume.
- Recognizing mixed conditions: Repeated histogram changes near zero may offer little directional clarity when price is moving sideways. Waiting for clearer price structure can be more useful than treating every change as a trade signal.
Alerts and live updates
The script provides two alert conditions: Bullish VMI Reversal and Bearish VMI Reversal. Add the indicator to the chart, create a TradingView alert, and select the desired condition.
The indicator recalculates on the open bar. Price and volume changes can cause readings and markers to appear or disappear before the bar closes. Select Once Per Bar Close when the alert should require the condition at the close. Recreate alerts after changing relevant settings, the script, symbol, or timeframe so they use the new configuration.
The script uses current-chart data and past values, with no higher-timeframe requests, lookahead, or markers shifted into previous bars. Its live-bar behavior still means an unqualified “non-repainting” claim would be misleading.
Limitations and open-source availability
VMI requires usable volume data and has no explicit fallback for missing volume. Depending on the selected feed, volume may represent traded volume or tick activity. Smoothing adds lag, and rolling normalization changes the scale as recent extremes enter or leave the window. Use standard candles or bars when evaluating its behavior.
This is an indicator, not an automated strategy. It does not place orders, calculate trading performance, or supply position sizing, stops, or targets. No win rate or profitability claim is made.
The publication is free and open source, with Pine Script v6 code provided under the Mozilla Public License 2.0 stated in the source. Users can inspect the implementation and study or adapt it subject to that license. Its purpose is market analysis and education.

Get access: smrtalgo.com
Join our Discord: discord.com/invite/f7gVrMPkaC
All content provided by SMRT Algo is for informational & educational purposes only. Past performance does not guarantee future results.
Join our Discord: discord.com/invite/f7gVrMPkaC
All content provided by SMRT Algo is for informational & educational purposes only. Past performance does not guarantee future results.
Exención de responsabilidad
La información y las publicaciones no constituyen, ni deben considerarse como, asesoramiento o recomendaciones financieras, de inversión, de trading u otro tipo, proporcionadas o respaldadas por TradingView. Obtenga más información en Condiciones de uso.
Get access: smrtalgo.com
Join our Discord: discord.com/invite/f7gVrMPkaC
All content provided by SMRT Algo is for informational & educational purposes only. Past performance does not guarantee future results.
Join our Discord: discord.com/invite/f7gVrMPkaC
All content provided by SMRT Algo is for informational & educational purposes only. Past performance does not guarantee future results.
Exención de responsabilidad
La información y las publicaciones no constituyen, ni deben considerarse como, asesoramiento o recomendaciones financieras, de inversión, de trading u otro tipo, proporcionadas o respaldadas por TradingView. Obtenga más información en Condiciones de uso.