Actualizado
Titpaud Omniscient Cipher B
Titpaud Omniscient Cipher B
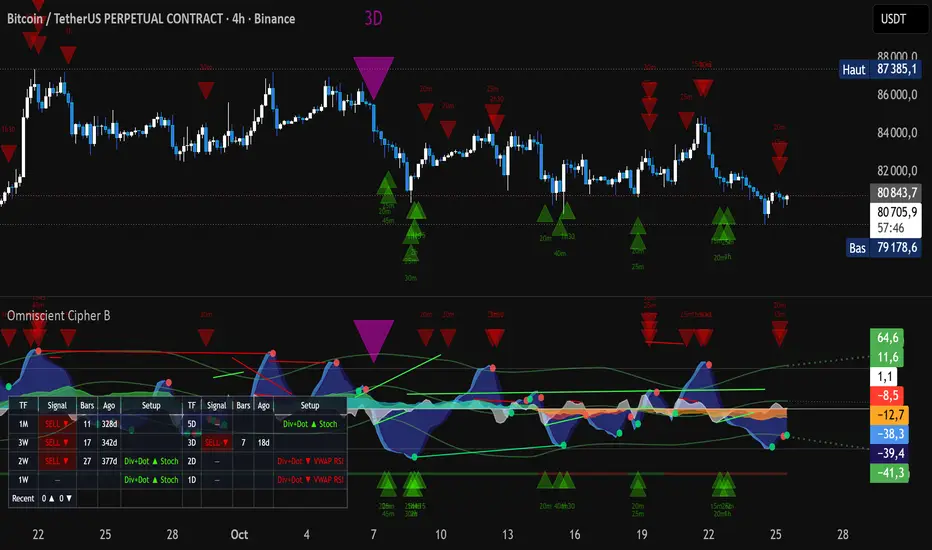
A WaveTrend oscillator with a strict multi-condition BUY/SELL signal, computed on up to 36 timeframes at once (1m to 3M) without repaint. Every signal of every timeframe is drawn in the pane and on the price chart, and a table lists the timeframes with a recent signal or a setup in progress.
CREDITS
This open-source script builds on the work of others. Please credit them too if you reuse it.
- vumanchu, "VuManChu Cipher B + Divergences" (Mozilla Public License 2.0): the core of the oscillator (WaveTrend display and cross circles, fractal divergence engine for WaveTrend / RSI / Stochastic RSI, RSI+MFI area, overbought/oversold levels, colors). Migrated from Pine v4 to v6 and modified. vumanchu credits dynausmaux, falconCoin, RicardoSantos and LucemAnb for parts of his work.
- LazyBear, "Indicator: WaveTrend Oscillator [WT]": the WaveTrend formula.
- andreholanda73, "MFI+RSI Area": the formula of the "MFI Vumanchu" money flow.
- Standard formulas through Pine built-ins: RSI, Stochastic RSI (Chong & Kroll), ALMA (Arnaud Legoux), HMA (Alan Hull).
Released under the Mozilla Public License 2.0, like the original VuManChu code.
WHAT IS NEW (original work by Titpaud)
- A strict BUY/SELL signal that combines four oscillators (see below).
- The same signal computed on up to 36 timeframes, without repaint, with one triangle per timeframe in the pane and on the price chart.
- A multi-timeframe table of recent signals and setups in progress.
- VWAP (WT momentum) divergences, a second money flow ("MFI Cryptoface"), a WaveTrend channel, smoothed MFI lines, extended lines and an alert() system.
THE PANE
- WaveTrend: light blue = WT1, dark purple = WT2 (3-bar SMA of WT1). White area = "VWAP" = WT1 − WT2, a momentum measure, not the volume-weighted average price.
- Circles: WT1/WT2 crosses (green up, red down).
- Money flow (two versions, overlaid by default): MFI Cryptoface = SMA(60) of the deviation of hlc3 from its 5-bar average (CCI-like); MFI Vumanchu = SMA(60) of (close − open) / (high − low) × 150.
- Divergence lines on WT2, RSI, Stochastic RSI and VWAP.
- Channel: highest and lowest WT2 over 30 bars, smoothed over 60 bars, with a mid-line. "Live" mode (default) never repaints; "Centered" mode is shifted into the past and repaints the last bars.
THE SIGNAL
A BUY needs, within 20 bars:
1. A regular bullish WT2 divergence with its pivot at −45 or lower.
2. A WT1/WT2 cross up with WT2 at −45 or lower.
3. Both money flows turning up.
4. Regular bullish VWAP, RSI and Stochastic RSI divergences found from 10 bars before the WT divergence to the signal bar.
One signal per setup; an opposite divergence cancels it. A SELL is the mirror image. Each condition can be loosened in "Signals Settings" (first group of the settings).
Why combine them: each oscillator alone gives many false turns; requiring them to agree keeps only the setups where momentum, money flow and price structure turn together.
SIGNALS OF ALL TIMEFRAMES
- A signal from another timeframe appears on the chart candle where its own candle closes, which is when it could be seen live: no repaint.
- Triangle size follows the ratio between the signal timeframe and the chart timeframe, so higher timeframes stand out without being oversized. Timeframes smaller than the chart ÷ 16 are hidden by default.
- Pine limits: 40 data requests (36 used), 500 labels (the oldest disappear first), the last 3000 chart candles and 1500 candles per requested timeframe. Very low timeframes on a high timeframe chart only go back a limited time.
THE TABLE
For each timeframe with a recent signal or a setup in progress: signal, bars since, time ago, and setup ("Div" = waiting for the cross, "Div+Dot" = waiting for the money flow and the other divergences, plus the divergences already in place). Signals older than 30 candles of their timeframe are removed. Closed candles only: no repaint.
ALERTS
Signal BUY / SELL and VWAP divergences on the chart timeframe. For all timeframes, create one alert with "Any alert() function call".
HOW TO USE IT
Use the signals at a level you already chose (order block, value area, higher timeframe support/resistance), and give more weight to signals agreeing across timeframes. Keep the channel in Live mode for real-time decisions.
Limits: in my own tests (BTC, ETH, SOL, XRP, 2020–2026, fixed stops and targets, 0.1% fees per order), the raw signals of earlier versions used mechanically did not beat random entries, and the current combination has not been backtested. This is a reading and timing tool, not a ready-made strategy.
For educational purposes only, not financial advice.
A WaveTrend oscillator with a strict multi-condition BUY/SELL signal, computed on up to 36 timeframes at once (1m to 3M) without repaint. Every signal of every timeframe is drawn in the pane and on the price chart, and a table lists the timeframes with a recent signal or a setup in progress.
CREDITS
This open-source script builds on the work of others. Please credit them too if you reuse it.
- vumanchu, "VuManChu Cipher B + Divergences" (Mozilla Public License 2.0): the core of the oscillator (WaveTrend display and cross circles, fractal divergence engine for WaveTrend / RSI / Stochastic RSI, RSI+MFI area, overbought/oversold levels, colors). Migrated from Pine v4 to v6 and modified. vumanchu credits dynausmaux, falconCoin, RicardoSantos and LucemAnb for parts of his work.
- LazyBear, "Indicator: WaveTrend Oscillator [WT]": the WaveTrend formula.
- andreholanda73, "MFI+RSI Area": the formula of the "MFI Vumanchu" money flow.
- Standard formulas through Pine built-ins: RSI, Stochastic RSI (Chong & Kroll), ALMA (Arnaud Legoux), HMA (Alan Hull).
Released under the Mozilla Public License 2.0, like the original VuManChu code.
WHAT IS NEW (original work by Titpaud)
- A strict BUY/SELL signal that combines four oscillators (see below).
- The same signal computed on up to 36 timeframes, without repaint, with one triangle per timeframe in the pane and on the price chart.
- A multi-timeframe table of recent signals and setups in progress.
- VWAP (WT momentum) divergences, a second money flow ("MFI Cryptoface"), a WaveTrend channel, smoothed MFI lines, extended lines and an alert() system.
THE PANE
- WaveTrend: light blue = WT1, dark purple = WT2 (3-bar SMA of WT1). White area = "VWAP" = WT1 − WT2, a momentum measure, not the volume-weighted average price.
- Circles: WT1/WT2 crosses (green up, red down).
- Money flow (two versions, overlaid by default): MFI Cryptoface = SMA(60) of the deviation of hlc3 from its 5-bar average (CCI-like); MFI Vumanchu = SMA(60) of (close − open) / (high − low) × 150.
- Divergence lines on WT2, RSI, Stochastic RSI and VWAP.
- Channel: highest and lowest WT2 over 30 bars, smoothed over 60 bars, with a mid-line. "Live" mode (default) never repaints; "Centered" mode is shifted into the past and repaints the last bars.
THE SIGNAL
A BUY needs, within 20 bars:
1. A regular bullish WT2 divergence with its pivot at −45 or lower.
2. A WT1/WT2 cross up with WT2 at −45 or lower.
3. Both money flows turning up.
4. Regular bullish VWAP, RSI and Stochastic RSI divergences found from 10 bars before the WT divergence to the signal bar.
One signal per setup; an opposite divergence cancels it. A SELL is the mirror image. Each condition can be loosened in "Signals Settings" (first group of the settings).
Why combine them: each oscillator alone gives many false turns; requiring them to agree keeps only the setups where momentum, money flow and price structure turn together.
SIGNALS OF ALL TIMEFRAMES
- A signal from another timeframe appears on the chart candle where its own candle closes, which is when it could be seen live: no repaint.
- Triangle size follows the ratio between the signal timeframe and the chart timeframe, so higher timeframes stand out without being oversized. Timeframes smaller than the chart ÷ 16 are hidden by default.
- Pine limits: 40 data requests (36 used), 500 labels (the oldest disappear first), the last 3000 chart candles and 1500 candles per requested timeframe. Very low timeframes on a high timeframe chart only go back a limited time.
THE TABLE
For each timeframe with a recent signal or a setup in progress: signal, bars since, time ago, and setup ("Div" = waiting for the cross, "Div+Dot" = waiting for the money flow and the other divergences, plus the divergences already in place). Signals older than 30 candles of their timeframe are removed. Closed candles only: no repaint.
ALERTS
Signal BUY / SELL and VWAP divergences on the chart timeframe. For all timeframes, create one alert with "Any alert() function call".
HOW TO USE IT
Use the signals at a level you already chose (order block, value area, higher timeframe support/resistance), and give more weight to signals agreeing across timeframes. Keep the channel in Live mode for real-time decisions.
Limits: in my own tests (BTC, ETH, SOL, XRP, 2020–2026, fixed stops and targets, 0.1% fees per order), the raw signals of earlier versions used mechanically did not beat random entries, and the current combination has not been backtested. This is a reading and timing tool, not a ready-made strategy.
For educational purposes only, not financial advice.
Notas de prensa
UPDATE- New "Display" group at the very top of the settings with the two main switches: "Show BUY/SELL signals" and "Show table". They were moved there from the "Signals Settings" and "Table" groups, so the signals and the table can be turned on or off as soon as the settings open.
No change to the signal logic or to any other default.

Exención de responsabilidad
La información y las publicaciones no constituyen, ni deben considerarse como, asesoramiento o recomendaciones financieras, de inversión, de trading u otro tipo, proporcionadas o respaldadas por TradingView. Obtenga más información en Condiciones de uso.
Exención de responsabilidad
La información y las publicaciones no constituyen, ni deben considerarse como, asesoramiento o recomendaciones financieras, de inversión, de trading u otro tipo, proporcionadas o respaldadas por TradingView. Obtenga más información en Condiciones de uso.