OPEN-SOURCE SCRIPT
RSI Background Color Indicator
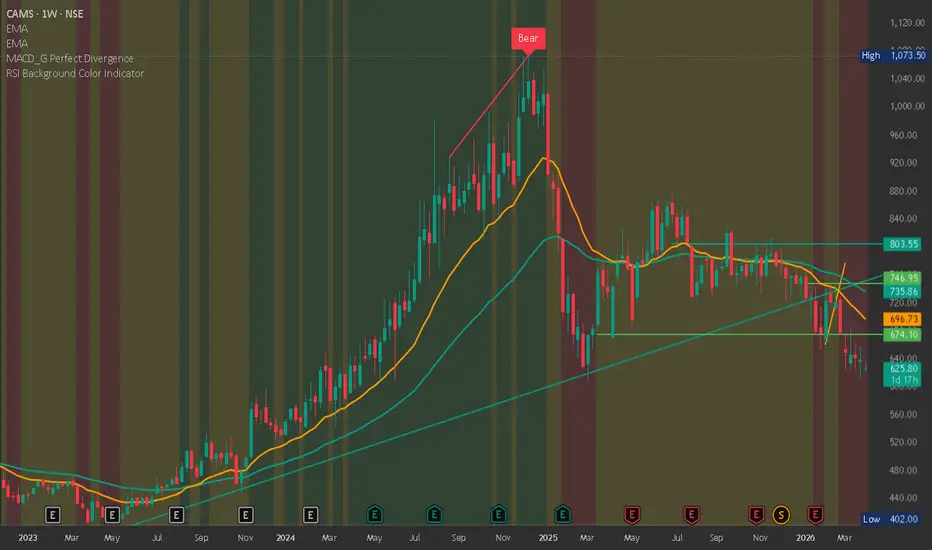
📊 RSI Background Trend Indicator
This indicator is designed to visually simplify market conditions using the Relative Strength Index (RSI) by dynamically changing the chart background color based on momentum zones. It helps traders quickly identify whether the market is bullish, bearish, or neutral without relying on multiple indicators.
⚙️ How It Works
The indicator calculates RSI and categorizes the market into three zones:
🟢 Bullish Zone (RSI > 60)
Indicates strong upward momentum and potential buying strength.
🔴 Bearish Zone (RSI < 40)
Indicates downward pressure and potential selling strength.
🟡 Neutral Zone (RSI between 40–60)
Represents consolidation or sideways movement.
The background color of the chart automatically changes based on these conditions, making it easy to interpret market sentiment at a glance.
🎯 Key Features
✔ Clean and minimal visual representation
✔ No clutter — focus only on momentum zones
✔ Works on all timeframes and instruments
✔ Customizable RSI length and levels
✔ Helps in quick decision-making
📈 How to Use
Use Green background to look for buy setups (pullbacks, breakouts)
Use Red background to look for sell setups (rejections, breakdowns)
Avoid trades or use range strategies during Yellow zone
⚡ Pro Tips
Combine with EMA trend (50/200) for higher accuracy
Use with price action (Support/Resistance, HH/HL, LH/LL)
Confirm entries with volume or breakout patterns
Works best when aligned across multiple timeframes
⚠️ Disclaimer
This indicator is for educational and informational purposes only. It does not provide financial advice. Always use proper risk management before trading.
If you want, I can also:
🔥 Optimize this description for more views & followers
🔥 Add SEO tags & title suggestions
🔥 Create a premium-looking indicator branding
This indicator is designed to visually simplify market conditions using the Relative Strength Index (RSI) by dynamically changing the chart background color based on momentum zones. It helps traders quickly identify whether the market is bullish, bearish, or neutral without relying on multiple indicators.
⚙️ How It Works
The indicator calculates RSI and categorizes the market into three zones:
🟢 Bullish Zone (RSI > 60)
Indicates strong upward momentum and potential buying strength.
🔴 Bearish Zone (RSI < 40)
Indicates downward pressure and potential selling strength.
🟡 Neutral Zone (RSI between 40–60)
Represents consolidation or sideways movement.
The background color of the chart automatically changes based on these conditions, making it easy to interpret market sentiment at a glance.
🎯 Key Features
✔ Clean and minimal visual representation
✔ No clutter — focus only on momentum zones
✔ Works on all timeframes and instruments
✔ Customizable RSI length and levels
✔ Helps in quick decision-making
📈 How to Use
Use Green background to look for buy setups (pullbacks, breakouts)
Use Red background to look for sell setups (rejections, breakdowns)
Avoid trades or use range strategies during Yellow zone
⚡ Pro Tips
Combine with EMA trend (50/200) for higher accuracy
Use with price action (Support/Resistance, HH/HL, LH/LL)
Confirm entries with volume or breakout patterns
Works best when aligned across multiple timeframes
⚠️ Disclaimer
This indicator is for educational and informational purposes only. It does not provide financial advice. Always use proper risk management before trading.
If you want, I can also:
🔥 Optimize this description for more views & followers
🔥 Add SEO tags & title suggestions
🔥 Create a premium-looking indicator branding
Script de código abierto
Fiel al espíritu de TradingView, el creador de este script lo ha convertido en código abierto, para que los traders puedan revisar y verificar su funcionalidad. ¡Enhorabuena al autor! Aunque puede utilizarlo de forma gratuita, recuerde que cualquier republicación del código está sujeta a nuestras Normas internas.

Exención de responsabilidad
La información y las publicaciones no constituyen, ni deben considerarse como, asesoramiento o recomendaciones financieras, de inversión, de trading u otro tipo, proporcionadas o respaldadas por TradingView. Obtenga más información en Condiciones de uso.
Script de código abierto
Fiel al espíritu de TradingView, el creador de este script lo ha convertido en código abierto, para que los traders puedan revisar y verificar su funcionalidad. ¡Enhorabuena al autor! Aunque puede utilizarlo de forma gratuita, recuerde que cualquier republicación del código está sujeta a nuestras Normas internas.
Exención de responsabilidad
La información y las publicaciones no constituyen, ni deben considerarse como, asesoramiento o recomendaciones financieras, de inversión, de trading u otro tipo, proporcionadas o respaldadas por TradingView. Obtenga más información en Condiciones de uso.